
PRINCIPLES OF MACROECONOMICS
ECON 203
PRINCIPLES OF MACROECONOMICS
Fall 2013 Quizzes: 1, 2, 3, 4, 5, 6
CONTACT INFORMATION:
Dr. Brian Goff (Grise 414; brian.goff@wku.edu)
Office Hours: MW 9-11
(I am in my office or on campus most days from around 9-3;
Feel free to stop by or make an appointment any time I'm around)
OBJECTIVE:
The course is
designed to provide an understanding of economic
forces, outcomes, and decisions at the national and
international levels with special attention to topics such as
the costs and benefits of markets and trade, economic
growth, measurement of national income, the nature and role of
monetary and fiscal policy, business cycle models, and other
topics. The discussion of these concepts, ideas,
and policy issues draws attention to ethical issues, problem
solving & critical thinking, global issues, and basic
business functions.
Special Note: This
course fulfills one requirement for General Education category
C -- Social and Behavioral Sciences.
TEXTS/MATERIALS:
Online Links including Concise Encyclopedia of Economics (CEE)
GRADES: Your
final grade is based on your final average: A=90+ B=80-89 C=70-79
D=60-69 F<60. Do not expect to "negotiate" or do "extra credit"
work for a higher grade
Bi-Weekly Quizzes (1-6) = 60% (Drop lowest
score)
Exam
= 30%
Assignments
(6) =
12%
Total
= 102% (Also, adjustments related to Classroom Policies below)
Bi-Weekly Quizzes:
These are multiple choice, matching, and short answer. NO
makeup or early quizzes will be given. Your lowest quiz
score will be dropped. If you miss more than one quiz
due to a significicant event (illness, WKU activity, family
matters, ...), your final exam will be weighted to
compensate. If you miss more than one quiz, you must
see in advance if possible or as soon as practical if not
known in advance.
Semester Exam: An exam over questions from all of the semester quizzes.
Assignments: Three of these involve some map/graphic, and three involve brief reports based on readings or
videos. These must EXACTLY follow the Brief Report Format.
Reports that
deviate from this format will receive zero or half credit.
Brief reports are individual assignments. You may not copy
from another student. ASSIGNMENTS MUST BE TURNED IN
(HARDCOPY, NO ELECTRONIC) BY THE END OF SCHEDULED CLASS PERIOD TO
RECEIVE ANY CREDIT.
Classroom Policies:
Orderly behavior and respect for others who are speaking
(including me) is expected. No cell phone or other electronic device use
(including laptops) is permitted. Violations of this policy will result in 1% reduction in final grade per incident. No food or drink permitted except for
bottles with caps or tops. If late, please enter with
a minimum of disturbance and be seated in the nearest seat.
Distracting or inappropriate behavior is not permitted.
Individuals involved in incidents that significantly violate these
policies will receive a warning and then will be notified of a
letter grade reduction per subsequent incident. Also see FAQ
Miscellaneous: Last day to drop with a "W" or change to audit is listed in the Academic Calendar. If you have an ADA covered disability requiring special consideration, please register with the ADA Compliance Office, and then see me. If class is canceled unexpectedly, any quiz will roll back to the next class meeting.
Th (Jan 30) Markets and Morality
Reading: Historical Views on Markets
Graphics/Data: Market Ethics PPT
Week 2
T
(Feb 4 ) Worldwide Living Standards
& Influences
Reading:
Standards of Living & Growth
(CEE)
Graphics/Data: Gapminder
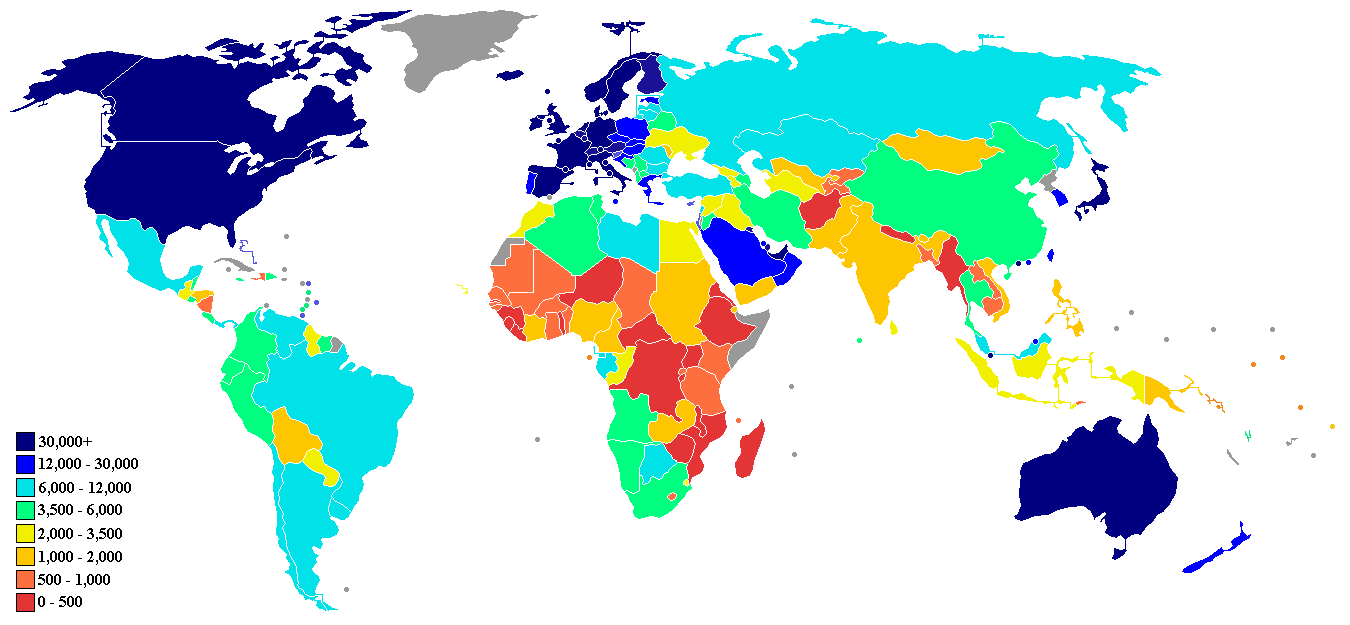
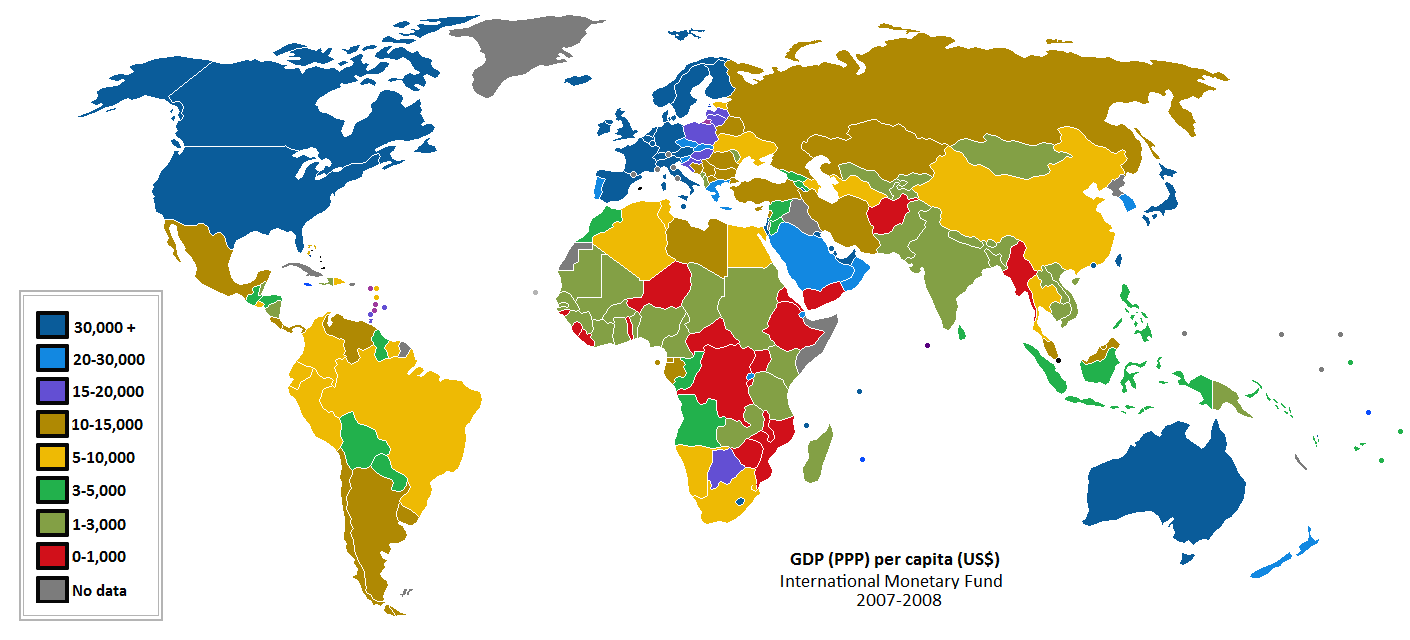
GDPPC-Life Expectancy IMF
Map of GDP Per Capita Sears
Catalogue & Labor Hour Data IMF Map US Long Term Growth;
Assignment 1 Due: Living
Standards Map (Due by end of class) -- GDP Per
Capita Country Cross Sections (CIA
Factbook Link) Data on Interactive Map
Th (Feb 6) Major Influences on Living
Standards, Limits & Tradeoffs
Reading: Market
Freedom and Growth (CEE)
Graphics/Data: Fraser
Economic Freedom Index Map (via Cato) Source
Data Heat Map of Economic Conditions
Korea at Night World at Night
Week 3
T (Feb 11) Sustainable
Growth
Reading: Natural
Resources (CEE) Sustainable
Development (Dallas
Fed) Malthus
& Say (MRU) Erhlich &
Simon
Graphics/Data:
Th
(Feb 13) Quiz 1
Supplemental Links Weeks
1-3: Empirics
of Economic Growth (CEE) World Bank Country Data Ethics
& Economics (CEE) Undercover Economist
Details
on Mechanisms of Growth & Development
Week 4
T (Feb 18) Pushing
Back Limits -- Innovation & Creative Destruction
Reading: Creative
Destruction (CEE)
Graphics/Data: Long Run Growth v. Recessions Graphic Mechanisms of Growth PPT
Th (Feb 20) Pushing
Back Limits -- Trade & Tradeoffs (Hume & Smith
v. Mercantalists; Modern Mercantilism)
Reading: Comparative
Advantage (CEE) Free
Trade (CEE)
Graphics/Data: Economic Cluster Mapping Mechanisms of Growth PPT
Assignment 2: Brief Report
(due by end of class) on Mercantilism
(CEE) See Brief Report Guidelines
Week 5
T (Feb 25) Market Prices and
Economic Coordination
Reading: Price
Controls (CEE)
Graphics/Data: Friedman Pencil
Video
Th (Feb 27) Quiz 2
Supplemental Links Weeks 3-4: Protectionism & Comparative Advantage (Dallas Fed) Gasoline Prices (STL Fed)
Measuring the Macroeconomy
Week 9
T (Mar 25) Key Macro Measures
Reading: GDP
PPT (Atlanta Fed; under economic indicators) Unemployment
PPT (Atlanta
Fed) Real
GDP; Real GDP growth rate Unemployment
Rate National
Net Worth;
Graphics/Data: FED GDP Slides & Video Economagic Most
Requested Data GDP Graphics
Th (Mar 27) Adjusting Macro Measures
for Purchasing Power
Reading: CPI
(CEE) Nominal to Real Values (Fed Resources)
Graphics/Data: Excel File w/Gasoline Prices
Movie
Box Office Data; CPI Quality Adjustments
Assignment 4: Create Graph of CPI and CPI-Medical
See Instructions (Due by end of class)
Week 10
T (Apr 1) Exchange Rates and Other Measurement Issues
Exchange Rates (wiki entry through fluctuations) Big
Macs & Purchasing Power Parity (Dallas Fed) Happiness
& GDP
Graphics/Data: Exchange Rate Data (Bloomberg) Big
Macs & PPP (Dallas Fed) Economist
Big Mac Website
Th (Apr 3): Quiz 3
Supplemental Links Week 3-4: House Hunters International (PPP-related)
MacroFinancial
System
Week 11
T (Apr 8) U.S. Monetary & Banking System
Reading: US Banking
History (Atlanta Fed) What is the Fed (SF Fed)
Gold
& Paper Standards:
CEE
Graphics/Data: Map of Shadow Banking System (NY Fed)
Th (Apr 10)
Monetary
Problems, Inflation & Financial Panics
Reading: Inflation
(CEE)
Graphics/Data: It's a Wonderful Life Financial Stress Index Currency Holdings 1930s Inflation Across Countries Inflation PPT
Assignment 5: Brief Report (due by end of class) on Banking Crisis of 1930s Text
or Video
(don't include panel discussion)
Week 12
T (Apr 15) Credit Markets, Interest Rates, & The Fed
Reading: Interest Rates (CEE);
Graphics/Data: StL FRED Interest Rates
Th (Apr 17) Quiz 5
Supplemental Links: Gold Standard and Great Depression; Financial
Crises -- 2008 Goff 2008
Financial Crisis Slides (ppt version) StL
Fed Timeline Benefits/Risk
Debt Household
Debt (STL Fed)
Map of Shadow Banking System (NY Fed)
Fed Public or Private (PHI Fed)
Business Cycles
Week 13
T (Apr 22) Business Cycles
Reading: Business
Cycles (CEE); The
Great Depression (CEE)
Graphics/Data:
U.S. Business Cycle Data (NBER) Long Run Growth v. Recessions Graphic Gapminder Long Run Depression Stats Unemployment & Recessions
Th (Apr 24) Competing Explanations of Business
Cycles
Graphics/Data: Oil Prices & Recessions Post WWII Unemployment
Assignment 6: Create
Graph of Unemployment Rate and % Change Real
GDP See Instructions (Due by end of class)
Week 14
T (Apr 29) Debates
over Stimulus Policy
Reading: John Taylor on Stimulus History
Graphics/Data:
Th (May 1) Quiz 6
Supplemental Links Weeks: Excel File with Classroom
Graphs; Barro on infrastructure spending Bernanke
Speech about Great Depression
MR
Problems of Fiscal Stimulus; Economic
Crisis in Iceland, England, & U.S (STL
Fed); Fiscal
Policy Stimulus (CEE); Fiscal
Policy Stimulus (Cochrane-Chicago GSB)
Week 15
T (May 6) Current &
Future Macro Issues: US Debt, Euro Area & Japan
Supplemental Links: Debt, Medicare, SS Wiki
US Public Debt Page Debt/Deficits/Entitlements
(STL Fed) (if really interested, see Cochrane
Video)
US Treasury Public Debt Page Economic Report of President Government
Finance Tables
Healthcare
Pricing Restrictions Zimmer
Q&A on Health Reform Health Care Expenditure OECD Data;
Immigration
& Macroeconomics (Phil Fed)
Infrastructure
Debate (STL Fed) T (Nov 29) Health
Care (CEE) & "Life is
Good" (Minneapolis FR);
Is Healthcare Different? (CEE) Gapminder GDPPC-Health%
Key Macro Lessons
Th (May 8) Semester Exam
Week 16
Finals Week
Brief Report Format
The Brief Reports must PRECISELY adhere to the following format
unless otherwise indicated (such as the Map excercise). You
will receive full for reports that adhere to the instructions in
all details. Half credit will be given for reports that
deviate from the instructions in minor ways. No credit will
be given for reports that deviate from the instructions in
significant ways.
1. Rports must be neatly typed or printed originals (NO SCRIPT --
"cursive") -- no crumpled papers.
2. All sentences must use standard American English -- subject,
verb, object (when needed), correct punctuation, aggreement of
subject and verbs, and so on.
3. Do not share information with others in the class about your
reports. Reports that appear to be copies or very close to
copies will receive no credit.
4. Reports must be turned in by the deadline to receive any
credit. You are encouraged to turn them in early if you may be
absent. Unexpected circumstances the day they are due do not alter
the deadline.
5. Reports must adhere to the template below. Reports that
deviate from its format will receive no credit. (Text which is in
italics below is for you to fill in and not for you to copy on the
summary. For example, do not write "paragraph 1".)
Your Name
Brief Reports #(put
report # here)
Put Titlle Here -- can be
shortened title
Paragraph #1: 1-2
sentences explaining the main question, issue, or problem
addressed in the readings
Paragraph #2: 2-6
sentences explaining a key point(s) from the readings.
Paragraph #3: 1-2 sentences describing a particular point which was especially important to you, with which you disagree, or which was unclear.
Note: Paragraphs should either be indented or separated by an additional space.
Go to St. Louis Federal Reserve data website: FRED.
Select Data Tools from the top menu, then select Create Your Own
Graph
In the Add Data Series Search Box, Type CPIAUCNS (for
Consumer Price Index All Items, Monthly)
If you do not have a color printer, select Black for Line Color
and Select Redraw Graph
Select Add Data Series and Type CPIMEDSL (Medical Consumer
Price Index) in search box
If you do not have a color printer, select Black for Line
Color and Dashed for Line Style and Select Redraw Graph
Select PDF so the graph opens into a PDF file and Print the
Graph.
Print the answers to these questions at the bottom of the graph:
1. About what year did the medical price index start
growing faster than the general price index?
2. List 3 medical procedures or technologies that made substantial
improvements to the quality of medical care since that time.
Go to St. Louis Federal Reserve data website: FRED.
Select Data Tools from the top menu, then select Create Your Own
Graph
In the Add Data Series Search Box, Type UNRATE (for US
Unemployment Rate)
If you do not have a color printer, select Black for Line Color
and Select Redraw Graph
Select Add Data Series and Type GDPC1 (Real GDP) in search box
If you do not have a color printer, select Black for Line
Color and Dashed for Line Style and Select Redraw Graph
For UNITS Select % Change from Year Ago and Select Redraw
Graph
Select PDF so the graph opens into a PDF file and Print the
Graph.
If you do not have a color printer or the recession shaded bars
do not print, mark them with a pen (red, green, blue) on
the horizontal axes.
Print the answers to these questions at the bottom of the graph:
1. Are large increases in unemployment or large decreases
in real gdp more closely associated with the timing of
recessions?
2. How many recessions have there been since 1950?
FAQ
Q: How can I prepare for the
quizzes? How can I do better in this class?
A: Come to class and pay attention. Read assigned
material. Practice answering past quiz questions as we cover
that material. Ask questions of me either in class, drop by my
office, or visit graduate assistants.
Q: I will miss a quiz
because of forensics, swimming, golf, .... When can I make-up it
up? May I take it early?
A: No make-ups or early quizzes are given but see me. For
legitimate absences, I will weight your final exam to
compensate. See me in advance if at all possible
Q: I'm doing poorly on
tests/assignments. Can I do work for extra credit?
A: No. Grades will be determined by the policies stated
above. I sometimes include a 1%-2% upward adjustment for
students who are regular in attendance and actively participating in class. This is not
automatic and subject solely to my discretion.
Q: Do the past quizzes that
are available online cover all material on current tests?
A: No. They are intended as one tool to use in
preparing for current tests, but the tests change each semester
with some material excluded, some included, and some changed a
bit. Warning: occassionally a past test question is
incorrect.
Q: My final grade is an 89.1, isn't that close enough to an
A? I need it to keep my scholarship.
A: An A is 90.0 and above, a B is 80.0-89.9 and so on. I will be glad to
correct any error that I make in computing grades, but grades are
not negotiable. Achieving a certain grade for scholarships
or any other reason is the student's responsibility.
Not really FAQ but a
clarification:
Q: What do you mean by "behavior that is inappropriate or
distracting"?
A: This includes but is not necessarily limited to
profanity, personal conversations, note passing, repeated cell
phone interruptions, texting, and other sorts of rude or
disruptive activities.
IMF Map of GDP Per Capita (PPP) 2009