
ISSUES IN CAPITAL MARKET ECONOMICS
Spring 2015
ECON 400/400G
ISSUES IN CAPITAL MARKET ECONOMICS
Spring 2015
External Sites:
Federal Reserve Info:
Federal Reserve System Article Search Engine / FRB of New York / FRB of St. Louis / Index of SEC Rules /
Blogs/Discussions/Research
Fama-French Forum/ John Cochrane CGSB Site/ Xavier Gabaix NYU Site/ Streetwise Professor/
Current Data
Bloomberg Economagic Economic-Financial Data
Dr. Brian Goff
GH 414/745-3855
Office Hours for Spring 2015: MW 9:30-11:30 (appointments & drop-ins welcome other times)
Objective
To acquaint students with several current issues on the border between
macroeconomics and financial economics, financial market microstructure,
and financial market regulation
Resources
Selected Readings On-Line
Grading (Undergrad)
Exam
I
= 30%
Exam II
= 30%
Assignments
=
20%
Reading Quizzes
=
10%
Total
=
100%
(A=90-100; B= 80-89; C= 70-79; D = 60-69; F < 60)
Weekly Reading Quizzes: Short, multiple choice quizzes over readings
Empirical Assignments/Presentations: On the empirical
assignments, students should put together a short (5-10 minute)
powerpoint presentation summarizing the empirical work. The
powerpoint slides should be
printed and turned in. The aim of the presentation is to summarize
the material (or the most important parts of it) in ways that best
communicate it to the other students using cut/past graphics, data,
bullets. Remember, more is not always better. Clear,
accurate -- keep those words in mind along with emphasizing connections
to background economic ideas (this isn't journalism class, it's
econ). You are encouraged to refer to other sources that may
enhance your understanding and presentation. There will be 2
graduate teams with more difficult material (some weeks).
Exams: These will be two short answer/multiple choice
tests.
Miscellaneous
Students with disabilities who require accommodation (academic
adjustments and/or auxilary aids or services) for this course must first
contact the Office of Student Disability Services in DUC A-200.
Last day to drop the course with a W is listed in the WKU Academic
Calendar.
Note: If a link is dead, please email me as soon as possible. Use Wikipedia, Investopedia, or similar sources to look up terms and concepts
Some articles, if accessed from off-campus, require going through WKU's E-Journal system. Go here http://www.wku.edu/Library/ejrnloff.htm# for instructions
Week 1 (Jan 28) Administration & Basic Ideas in MacroFinance & Market Microstructure I
Class Administration
MacroFinance and Time Series Data Background
Using Stat Software
Assignment for Next Week: Statistical Primer Using Gretl and data sets Shiller Monthly Stock Data (Gretl) Shiller Annual Stock Data (Gretl)
(Use GA Assistance and Gretl Primer)
All
Students:
A1) Open Gretl and become comfortable with key features
(opening files, generating new variables, generating stats, opening command log, using console)
A2) Open
the Shiller Monthly file, and compute real (CPI
adjusted) values of SP, GDP, and PCE by multiplying each variable by the
present CPI (2014=238) and dividing by the CPI in each period
A3)
Generate (annual) percent changes (example: SPrpca =
(SPr-SPr(-12))/SPr(-12) ) for real SP500 Index, real GDP, and real
Personal Consumption
Expenditures (for small differences apx equal to d(logSPr)
A4) For the following sample periods generate summary statistics for
these variables (use the console and summary command to do them all at once)
1871.01-2013.12: SPrpca
1947.01-2013.12: SPrpca, gdprpca, pcerpca
A5) By hand calculate the "Sharpe Ratio" of
each variable = Mean/Standard Deviation
A6) Print (clearly) brief
answers to the following questions on the back of your printed output
-- What are the mean annual percent changes in these variables?
-- How do the standard deviations compare?
-- How do the Sharpe Ratios compare?
Grad Students:
G1) Run an OLS regression using real SP as the dependent variable
and its 1-period lag as the independent variable; Save the residuals
G2) Run a
regression using the residuals as the dependent variable and their 1-period lag as the independent variable
G3) Select 3
subsample time frames (of at least 3 years); Run the real SP and its lag
regression and see if you can find a period where the coefficient in
the regression differs significantly from 1
G4) Generate a
simulated random walk
-- Open Gretl Console under Tools; smpl
1871.1 1871.1 >series simrw=0 > smpl 1871.2
2013.12 >genr simrw =
simrw(-1) + randgen(N, 0, 1) >smpl 1871.1 2013.12 >genr
simrw = simrw + 50 (recenters
to 50)
-- Run the same regression for
this variable, the ADF, and Print a time series plot for it
G5) Prepare 2-3
Powerpoint slides explaining what G1-G3 mean
Related Links: Fama MN Fed Interview Fama AEI Interview (starts in middle) coin flipping
Week 2 (Feb 4 ) Stocks, Random Walks, and Efficient Markets
Reading Quiz: Efficient Capital Markets -- CEE Cochrane on Fame and ME Wiki on Present Value
Related Links: Shiller Data Site Mehra on Equity Premium The Mismeasurement of Risk Barro Disasters NBER Macro Finance Puzzles (p. 2-3 only)
All Students (undergrads utilize GA assistance as needed):
A1) Run a regression with SP500 annual returns in percent (spreturn) and its one period lag
A2) Run a regression with SP500 annual returns and 1-period lag of Shiller PE ratio (peratio) as independent variable
A3) Print (clearly) brief answer to the following questions on the back
of your printed output
-- Do one month lagged returns in stock returns or one month lagged price-earnings
ratios help predict current percent changes in stock returns?
-- What does this appear to indicate about using current information to predict future stock prices?
Grad Students:
G1) Compute 5 year average SP real returns t+1 to t+5 (e.g. spreturn5 =
(spreturn(1) + spreturn(2) + spreturn(3) + spreturn(4)
+spreturn(5))/5 )
G2) Run regressions with 5 year average returns as the dependent variable and
with Shiller's PE ratio (in current year) as the independent variable
G3)
Run regressions with 5 year percent changes in earnings as dependent
variable and with Shiller's PE ratio (in current year) as the
independent variable
G4) Print your results and write a short explanation on the back as to what you found and what it means
Week 3 (Feb 11) Beyond Random Walks, Predictability of Stock Prices
Reading Quiz: Cochrane on Efficient Markets Today
Week 4 (Missed Due to Snow Day)
Revised Week 5 (Feb 25) Topics on Stock Prices
Reading Quiz: Bubble, Bubble (frb-stl) Tulipmania (JSTOR link through WKU)
Vox Barro on Disasters and Equity Premium
Related Links: Bubble Regressions Campbell Bubble in Bond Market? Stock Market Crashes and Depressions (Barro and Ursua) Shiller and Fama NPR Interview
Assignment for Next Week: Fama-Bliss Data Gretl Data
All Students:
A1) Suppose the price of a 1 year bond is 98 and it pays nothing until
the end of the 1 year, show how to calculate its yield (interest) rate (wiki)
A2) Compute summary statistics on 1 year bond return (returntb1), 10 year bond return (returntb10yr), and SP 500 (returnsp) measured as nominal annual percent changes
A3) Generate a time plot of these series
A4) Generate the correlation coefficient between these three variables
A4) Print the output and summarize the relationships
Graduate Students:
G1) Generate a time plot of y1, y2, f2, f2y1 yy21
G2) On back of plot, draw a simple graphic illustrating the meaning of y1, y2, f2
(Note: y1 = actual 1 yr rate; y2=actual 2 year rate; f2 = implied 1 year rate in year)
(Note: f2y1 = difference in f2 and y1; meaning the difference in implied 1 year rate in year 2 and actual 1 year rate)
(Note: yy21=difference in y2 and y1; meaning the difference in actual 2 year rate and actual 1 year rate)
Revised Week 6 (Mar 4) Interest Rates, The Term Structure, and Risk
Reading Quiz: Bond Valuation Understanding the Term Structure of Interest Rates (StL Fed) Wiki on Yield Curve Wiki on Forward Rates
In Class Empirical Studies (not part of assignment)
-- Regress yy21 as dependent variable on f2y1 as
independent
-- Regress yy51 as dependent variable on f5y1 as independent
-- Before Fama-Bliss, the
expected coefficients on the regressions above were 1.0 with high R2
-- After Fama-Bliss ... G4) Prepare a few slides explaining your explorations
-- Regress rx2 as dependent variable on fy21
-- Regress rx5 as dependent variable on fy51
-- Comparing Estimates of Risk Premia e400 Return and Risk Premia Data
Week 7 (Mar 11) Spring Break
Week 8 (Mar 18) Exam I
Week 9 (March 25) Debt Basics & Background
Reading Quiz: 800 Years of Financial Folly (VoxEU) Modigliani-Miller Theorem (Wiki) Cochrane Model of Govt Liabilities
Related Links: Debt Basics PPT Crisis of 2008 PPT
Assignment for Next Week: Cross Country Interest Rates & Debt/GDP Ratios
Data: OECD MacroFinance Data (Excel File with explanation of Country Codes)
Note: The OECD data file is a panel data 1961-2013 for OECD
members (included only in years of membership). It merges (some)
variables from IMF's World Economic Outlook database, World Bank
World Development Indicators database and Global Financial Development
database. This last one (GFDD) is the most useful on this
assignment. In the Gretl file, these variables have names from
data11 to data104 and appear at the bottom of the datafile. All
variables have labels. Gretl doesn't handle text input so Country
Codes are just numbers in the Gretl file. Names appear with Codes
in the Excel file.
All Students
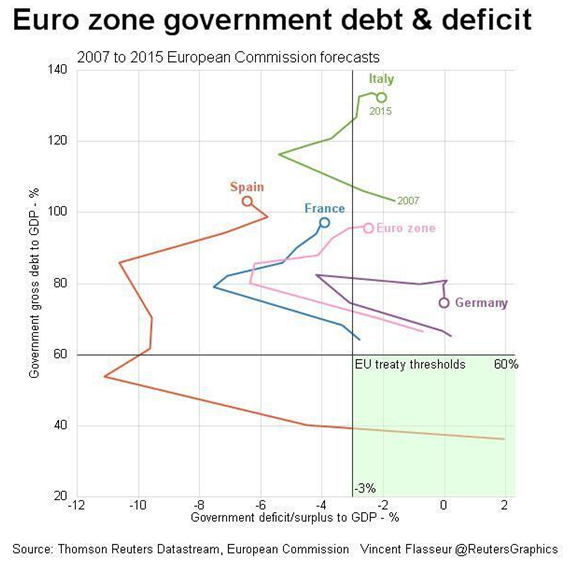
A1) Generate time series plot of the Debt/GDP ratios for the US, Japan, Italy, Spain, France, Germany, Greece (use variable #133 in Gretl file)
Grad Students
G1) Run a regression for country interest rate on long run bonds (variable #212) imitating the one in Hamilton's fiscal tipping points (Debt/GDP, Debt/GDP^2, Current Account/GDP, CA/GDP^2)
Current Account to GDP is variable #121
G2) Run the regression again but put in country specific dummy variables (country fixed effect)
G2) Generate a PPT presentation of your results and address these questions:
-- why use the square of debt/GDP?
-- what role does the country fixed effect play?
-- how do the results change with country effects?
Week 10 (April 1) Sovereign Debt & Fiscal Tipping Points/Risks in U.S.
Reading Quiz: Fiscal Tipping Points US Looming Disaster US
Related Links: S&P Global Credit Risk Report Goff PPT on Crisis
Week 11 (April 8) Assessing Current/Future Global Risks from Debt
Reading Quiz: US EU Japan Bass Chicago CGSB Video
Related Links: S&P Global Credit Risk Report SoberLook 1 SoberLook2 Predicting Sovereign Debt Crisis
Week 12 (April 15) Assessing Risks to U.S. States from Fiscal Imbalance
Reading Quiz: America's Greece (Economist) Joshua Rauh Podcast
Related Links: S&P State Ratings over Time State Ratings Map Rauh & Novy-Marx NBER on States Crisis in Local Pensions (Rauh)
Excel File with Kentucky Data Needed Quantity of Govt Debt (Prescott)
Assignment for Next Week: Interest Rate Data
All Students:
A1) Compute changes differences in the yield curve (10 year Treasury Bond rate minus) 1 year Treasury rate
A2) Generate a time series plot of annualized percent changes in industrial production (indpropca), the term difference variable from step 1, and recessions
A3)
Grad Students
G1) Restrict the sample to periods where the recession variable equals 1 and then with recession variable equals 0
G2) Recompute the the summary statistics and correlations for these the recession and non-recession sub-samples
G3) Compute the correlation matrix for the various risk premia variables (see labels)
G4) Regress recession as the dependent variable against each of the risk premia variables
G3) Print the output and summarize the differences in relationships between these variables in recession and non-recession periods and the regression evidence
Week 13 (Apr 22) Yield Curve Spreads as Key Market Signals
Reading Quiz: Yield Curve (Wiki through relationship to business cycle) Decoding Messages (Richmond Fed)
Related Links: Yield Curve as Predictor of Recessions (NY Fed)
Assignment for Next Week: Rent-Sales Price Ratio, Gold-Silver Prices Housing Data
(The housing data is from Shiller. It lists a
housing price index (HPI) and rental price index (CPIRENT) for
1914-2013)
All Students:
A1) Compute a time plot of housing price index and rental price index (on same plot)
A2) Compute a housing price to rent price ratio using 1980 as the base year (ratio = 100 for 1980)
A3) Compute a gold to silver price ratio using 1980 as the base year again
A4) Generate time plots for the price-rent and for gold-silver price ratios (separate graphs)
-- Print answers to the following questions on the back of the printed output:
-- When are these ratios unusually high and low?
-- How did the gold-price ratio behave before,
during, and after the financial crisis of the fall of 2008?
Grad Students: Gold Silver Data
(The metal prices data is monthly from 1968.1 to
2014.1. It lists prices of gold and silver in dollars per ounce)
G1) Generate a time plot of gold prices and silver prices (on same plot)
G2) Regress the log of silver prices as the dependent
variable with the log of gold prices as the dependent variable; save the
residuals
G3) Plot the residuals
G4) Regress the residuals on their one period lagged
values
G5) Using the plots for all students, the estimates in steps 1-3, as well as adding other variables to the data set,
-- when are gold prices high relative to silver and vice versa?
-- do the residuals tend to return to zero?
-- does changing the time frame make any difference?
-- are the residuals predictable by some other variable?
G6) Generate a 10 min PPT explaining your findings and answers
Week 14 (Apr 29) Spreads and Ratios as Key Market Signals
Reading Quiz: Arbitrage (Wiki to section on "Types") Cointegration (Wiki) Manhattan Prices & Rents (NY Fed)
Week 16 Finals
Does Fed Control Rates (Fama)
FRB Boston Why So Many Bad Real Estate Decisions? Hamilton May 08 Dallas Fed on Real Estate Prices More Dallas Fed (Grad Only)
Related Links: Error Correction Model of M2 Richmond Fed Gold Silver Price Rent Graphics
Topics in Market Microstructure: Market Making, Transactions Costs, Bid-Ask Spread
Reading Quiz: Wiki Market Maker Bid Ask Spread NYSE CBOT Bond Market Foreign Exchange Market FIX
Jenkins: What do Shareholders maximize
Related Links: NYSE CME Group Yahoo Finance
Assignment for Next Week:
Grad Students:
G1) Select one of the 3 items below. Prepare a 10 minute PPT presentation explaining the issue and the economics behind it. You may work in 2 person teams. I have listed links as starting points. You should do some investigative work from there
-- Futures Market Speculation and Spot Price Bubbles Streetwise Professor and Econbrowser (James Hamilton) for posts between 2008 and 2012
-- Centralized Clearing Streetwise Professor for posts over last 6 years (look under counterparty risk also) Hamilton June 08 + Hamilton (Nov 09)
-- Front-Running WSJ Book Review Streetwise Professor
-- Insider Trading Restrictions Insider Trading Debates + CEE on Insider Trading
Assignment for Next Week: Measuring Financialization and Its Impact OECD MacroFinance Data (Excel File with Country Codes)
All Students
1) Generate a time series plot of data103 (stock market capitalization
to GDP) for US, UK, Iceland, and one country of your choosing
Grad Students
G1) Construct two measures of the degree of financialization of an economy (services-based, asset or liability based)
G2) Using plots, summary stats, and/or regressions, show how the
financial crisis of 2008 impacted countries with low, medium, and high
degrees of financialization (by one of your measures)
Related Links: Related Links: S&P Global Credit Risk Report Predicting Sovereign Debt Crisis Goff PPT on Crisis Modigliani-Miller Japan US SoberLook 1 SoberLook2
Financialization and Debt (How Much Is Too Much)
Reading Quiz: Cochrane on Financialization Crisis & Finanicalization in UK, US, Iceland Jenkins on Cyprus
Related Links: Crisis Timeline Goff PPT on Crisis Systemic Risk & Financial Crisis Bubbles or How Unusual Stock Market of 2008 Crisis and Bank Opaqueness
Demographic Shifts and Markets
Key Questions: What impacts will demographic shifts have on asset values?
How accurate are long run demographic predictions?
Data on Demographics and Stock Values: Vox Demographics and Stock Predictability + "Future Shock" + Milken Rebuttal
The Search for Safe Assets
Key Questions: What assets do people seek out when markets are troubled?
What
are attributes of these assets that are common and what are different
(up/down movements; variance; ...)?
Beckworth Post
Search
out references on forces behind gold and silver prices; Present data on
movements of these series (and their ratio and difference); examine the
cointegration of these time series (be careful with unit of time);
Financialization
Key Questions: Did the financial industry grow too large?
What
changes to the financial industry might best reduces changes of future
bubbles/crashes?
See as well as WSJ article on Cyprus that I sent by Holman Jenkins; Explore/examine World Financialization Data
CBO Budget Outlook to 2012 Conference on Looming Fiscal Crisis Unpleasant Monetarist Arithmetic (Cochrane)
Needed Quantity of Government Debt (Prescott) Barro on Ricardian Equivalence
FRB Richmond Econ of Sovereign Defaults
Jenkins WSJ - None Dare Call it Default Monetary Challenges Unpleasant Monetarist Arithmetic (Cochrane)
Why are FX rates hard to predict or explain?
Fx Rates: Why are FX Rates Hard to Predict + FX Rate Conundrum Micro-Macro Disconnect and PPP or Can Oil Prices Forecast Exchange Rates
Related Links: Rational Speculation & Exchange Rates (JME) Conflicts and Commodity Prices Exchange Rates and Business Cycles
MacroFinance Policy Issues & Questions
Key Questons:
Assignments/Presentations: Undergrads read 3 of following articles. Grad students read all plus Robust Capital. Assemble a 10 minute PPT that addresses 1) source(s) of 2008 crash; 2) Fed reactions to crash; 3) Future Policy Changes/Improvements. Don't simply do a summary. Read/assess/weigh the points and try to come to your own conclusions
Boston Fed President on Crisis & Policy William Poole Key Questions about Fed Actions (Book Review) Cochrane on Financial Crisis and Policy + Hamilton Reply
NY Fed President Lessons from the Crisis Jenkins Next Bailout the Last Taming Too Big To Fail (Dallas Fed Speech)
Grad Student Extra: Robust Capital Regulation
Measuring Bank Specific Systemic Risk Influences on Systemic Bank Risk Fed Reactions to Crisis (Dallas Fed)
Does CEO Pay Make Economic Sense? Is CEO Pay Really Inefficient? CEO Pay Jenkins (Reply to Question) CEO Pay Reynolds
How Sustainable/Unstustainable Is Kentucky's Long Run Fiscal Situation? Excel File on KY (update for 2012; for more info see KTRS report Financial or Actuarial http://ktrs.ky.gov/05_publications/index.htm
How Much Did the Size of a Nation's Financial Sector (finanialization) Matter for the 2008 crash and Why: World Financialization Data
Examining the Relationship between Gold & Silver Prices since 2007
Relationships between Stock Prices and Commodity Prices
Similarities and Differences in the Crashes of 1929 and 2008
Ideas and Policies for Regulation of Systemic Risk: Vox Critical Assessment Dodd-Frank Zingales - JAcctResearch May 2009)
Do Central Banks (such as the Fed) Increase or Decrease Systemic Risk?
Insider Trading: Insider Trading Debates + CEE on Insider Trading
Convergence and Divergence in Eurozone Bond Spreads and What's Down the Road?
Was There a Real Estate Bubble and How Would One Decide? Shiller Real Estate Data
What's Been Driving Commodity Pricing: Hamilton June 08 + Hamilton (Nov 09) + SWP Stuck on Stupid + SWP Reply to Hamilton + Vox on Financialization of Commodities
Commodity Price Boom in Perspective Did Easy Money Fuel Commodity Boom
Limits on Short TransactinsOverstock.com; Limits on Short TransactionsInvestopedia
SEC Study on Marked to Market Accounting
Debates about Financial Market Regulation Part 2
Wiki Terms: Clearinghouse; Counterparty Risk; Principal-Agent Problem
Undergrad Assignment (15 min. PPT on Core Issues in Financial Market Regulation & Analysis of Dodd-Frank Legislation
( ; Krozner Corporate Governance CEE (SWP - Agency Problems 9-09)
Grad Assignment: Basics of Clearinghouses
and Reasons for and Against Centralized Clearinghouse System (See
above + Wiki and SWP - Counterparty Risk 8-09 SWP - 5-09)
Related Links: Criminalizing Agency Costs Homan Jenkins (WSJ articles); Overview of Issues in Corprate Governance (frb-ny 2002)
Squam Lake Working Group on Financial Regulation (Clearinghouses; Overall; ...)
(SWP 1-09)