The
Once and Future Wallace
Real World Studies I: Interior Zonation of the Earth.
Introduction
Inasmuch as there is quite a difference between the "what might be" world of simulations and the "what is" of the real world, I could hardly hope to attract any attention to this model of spatial organization were I unable to point to any actual systems that appear to manifest the same basic kind of organization as the simulated situations. In the last simulation discussed, we looked at the results produced when 39 slight variations on the actual internal differentiation pattern of the earth--into zones we have termed its core, outer core, mantle, and crust/atmosphere--were put through the double-standardization process I have described. Here, we begin the "real world" studies section by continuing on with this analysis, and using not average widths of the mantle and crust, but actual ones.
I should first emphasize that in the model I have introduced I have posed that implicit and/or actual flows of information exist among the four (we will stick with four at this point because the simulations--as well as, for that matter, a number of real world studies I have carried out--seem to fortify the a priori intuition that this must be the number) subsystems that at one level or another (or many) make up any spatially-extended system entity. On the basis of what I have so far looked at, it would appear that the different subsystems represent, most fundamentally, structure designed to transmit and/or originate different levels of energy and information. In this sense they are not organized the way the classes are that are described in the first essay in this general section, in effect as historical, stochastically-generated artefacts. Rather, they underpin the system's function as an engine-like entity within their own environmental setting, however small or large that may be. Thus, in measuring this function we must be attuned to whatever actual flows, or surrogates representing the same, that are maintaining the system's integrity.
In some instances the internal structure may be directly evident, for example, as it has evolved in conjunction with simple surfaces and volumes such as whole planets. In such instances it is reasonable to look at the patterns involved, as ostensibly they have evolved under the common, long-term, influence of general forces, especially gravity. But in most instances the differentiation of the system will reflect much more complicated influences, including ones that change with time. In these cases useful surrogates that are measured will not necessarily be simple spatial ones, or even if useful at one point in the history of the system's development may not be so later (as we will see later when we look at an example of regional population growth in the human world). If the general model discussed here is valid, it must pertain, it would seem, to the suborganization of human bodies as well--but these undergo different kinds of growth at different periods, and for different reasons, and of course are expressed as a finite shape that is not a simple sphere or spheroid.
For these reasons, the first three sets of examples discussed here are relatively simple ones, ones which are taken from inanimate nature. These are followed by an example taken from animate nature, and a further one from human population growth, as expressed in regional development terms. All are set within relatively simple geometric surfaces, and are easier to perform useful measurements on accordingly.
The Zonation of the Interior of the Earth
Various indirect forms of evidence have given scientists a fairly complete knowledge of the internal structure of the earth, at least to the extent that they can convincingly show that it has differentiated into four general zones: again, the core, outer core, mantle, and crust/atmosphere. Zonal boundaries are now identified to within a few miles even in general reference sources, so I used several of these to come to a summary average I could use (as I did in the simulations, in fact). The key data, however, concerned the greatly varying distance to the mantle from the surface (typically, much less under the oceans, and much more under the continents). I am not aware of any generally available published source that does a better job of relaying this information than version two of the project CRUST 5, which maps worldwide the estimated distances from surface to mantle in two degree squares; this has been made available online and it was from this source that I worked.
Three sets of three analyses were run, and using the two different spatial autocorrelation measures employed in the simulations. Because it was not initially clear to me (and still isn't) whether zone four, the crust/atmosphere, should be considered comprised only of rock, or of rock plus water, or of rock plus water plus atmosphere, all three possibilities were investigated. Most interestingly, I think, I used three different time periods in geological history: the present, and the earth as it was 95 million and 200 million years ago. To make possible decisions regarding crustal thicknesses in ancient prehistoric times I extrapolated the depths as understood from CRUST 2.0 ( http://mahi.ucsd.edu/Gabi/rem.html ) with the aid of Smith, Smith and Funnell's Atlas of Mesozoic and Cenozoic Coastlines, which provides enough detail regarding ancient coastlines, mountains and other topographies to make such extrapolations possible (or so I hoped, anyway).
It was possible to assign class membership to the twenty thousand or so sample grid points involved through a combination of programming (for the core and outer core) and individual eyeballing (to distinguish whether given sample points should be assigned to the mantle or surface zones, given the worldwide irregular shape of the interface between them). Depending on the definition of the "surface zone," some two to three hundred sample points ended up being recorded in this fourth class.
Once all the sample points were assigned to the four zones (classes) for each analysis, the spatial autocorrelation algorithms were applied and summary scores compiled as a (symmetric) four by four matrix, and then double-standardized.
The results are best set up in a table, with the corresponding simulations employing wholly concentric zones shown first, for comparison:
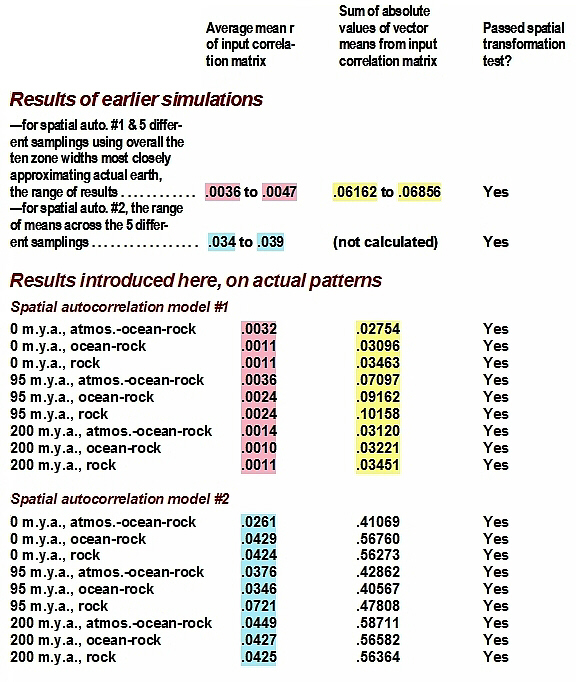
Table 1. See text for explanation.
There are several things going on at once here. First, it should be noted that in all the instances above, the basic test of three-dimensional expression was passed. I was mainly interested, however, in whether the examination of the real world pattern of zonation, with its surface zone being irregular because of differences in the thickness of the crust, would show a further tendency to reduce the two statistical measures of redundancy/disequilibrium (the two r statistics) toward zero. Before that matter is addressed, remember also that I looked at three different definitions of "surface zone": one including only the rock in the crust, another combining this with the hydrosphere, and a third combining the second with a further fifteen kilometers of zonal width extension into the atmosphere. Also, there are two sets of results above, using two different spatial autocorrelation measures. The second of the two measures seems to produce no interpretable differences between the simulations and the real world studies, and, I guess one would put it, leaves less disequilibrium unaccounted for to begin with. Still, I admit that it yet might be the more appropriate measure, and, among other possibilities, that the sample size is still not large enough to produce indisputable results.
Also, one cannot tell for sure at this point which combination of surface elements produces the best fit. Using one of the r statistics, the rock-ocean-atmosphere combination does worst at each of the three time periods, but on switching to the other r statistic, this combination does the best in all three.
Those matters noted, we can look at the central question of whether the two r statistics improve markedly in switching from the simulations to the three real world periods. Clearly, they do. Remember that of the nearly two hundred simulated real earth zonations using the first spatial autocorrelation model, the very best first r statistic arrived at was .0019 (the worst was .0052) and the very best second statistic, .0530 (worst, .1271). Of the ten of these that most closely approximated real earth zonal widths, the corresponding values were .0036 (worst, .0047), and .0616 (worst, .0686). All of the values compiled for either zero million years ago or 200 million years ago best any of these by a wide margin; the values for 95 million years best most of these for the first r statistic, and do rather worse for the second.
These results may not be perfect, but again they strongly support the basic thesis here. First, it must be remembered that not one in a thousand matrices of random numbers produce a correlation matrix whose mean r value (the first r value, here) is as low as the .001 value recorded here for two of the three analyses reported. The third was a bit off this value, but considering that decisions for inclusion in one class or the other were done by hand, and using a fairly coarse sampling of the data, it could only be expected: with only two to three hundred out of twenty thousand in the final class, it does not take more than a handful of spatially autocorrelated mistakes to start throwing things off.
What could be more intriguing than these results? It appears reasonably--or perhaps I should say, tantalizingly--possible that a re-analysis of this setting, employing ten times as many sample points and more sophisticated measurement procedures not calling for individual decisions on data point inclusions, could in fact demonstrate outright that the earth has zonally differentiated into four sublayers whose spatial orientations relative to one another define, exactly, the form of dynamic equilibrium anticipated through the model discussed here. Beyond present efforts, what currently existing train of thought is there that can contextualize such a "coincidence"? And not only explain it for conditions at the present, but apparently backward through geological time as well?
There will unfortunately be some who read these words who will immediately think, well, if its occurrence is so unlikely, and it's not just a coincidence, then it must have been irrevocably "guided" to attain this state. This would be an unfortunate assumption: in this model, structural outcomes are accepted as driven (in large part, anyway) by the same general forces as we have always recognized in our study of nature. Before, the possibilities of structure were viewed as being largely unlimited; infinite. In the current understanding, a much smaller range of outcomes is looked to, but these are still infinite in number. THIS SHOULD BE CLEAR FROM THE FACT THAT THE EARTH OF TWO HUNDRED MILLION YEARS AGO, AT THAT TIME CHARACTERIZED BY AN ENTIRELY DIFFERENT PATTERN OF LAND AND OCEAN, YET TESTED OUT THE SAME IN THE PRESENT ANALYSIS AS DID THE EARTH OF TODAY.
These studies were carried out in 2003-5. Over ten years earlier I had worked up similar analyses based on about half as many sample points; the results were weaker, but not inconsistent with these. In 2007, in an effort to replicate the 2003-5 results, I started from scratch and performed another set of analyses with newly generated samples (but at about the same sampling density as was used in the 2003-5 work). The results were a slight bit weaker than those outlined above, but still consistent with identifying a difference between the real zonations and those simulations employing a surface zone of unvarying thickness.
I should perhaps note that the interior of the Sun also consists of four fairly specific zones. I predict this model of structure will also fit its internal spatial differentiation--right up to the solar granulation pattern of the photosphere, which will in theory mimic (at least in terms of degree of spatial clustering of energy/materials) the nonrandom pattern of crustal thicknesses on the earth.
While yet admitting to the possibility that I have somehow measured or calculated something in a fashion leading the results astray, if there is even a chance that they are fundamentally correct it would seem most unwise at this point just to look the other way. While the model studied here anticipates all extended space systems as being constituted according to the same basic structural rules, and though the means of measuring these in corresponding detail may not always be immediately obvious, this doesn't mean that the example given in this section is, convenient to criticism, one of a kind. Just to prove that point, I would now like to present some other empirical studies that also bear on this matter.
*Note that in 2014 I published the results of the 2007 replication. The paper may be obtained here: http://dx.doi.org/10.4236/ijg.2014.54036 .
_________________________
Continue to Next Essay
Return
to Writings Menu
Return
to Home
Copyright 2006-2014 by Charles H. Smith.
All rights reserved.
Materials from this site, whole or in part, may not be reposted or otherwise
reproduced for publication without the written consent of Charles H. Smith.
Feedback: charles.smith@wku.edu
http://people.wku.edu/charles.smith/once/spa1.htm