The
Once and Future Wallace
Real World Studies IV: Butterfly Wings.
2006 Study
Although the measure of medium to large scale inanimate systems seems to offer the best bet for initial testings of the model of organization discussed here, one should not overlook other possible settings. In the case of butterfly wings, there are at least two obvious angles that one might explore.
First, and quite apparently, butterfly wings are systems for flight comprised of four structural components, arranged in pairs. This alone is suggestive, since inasmuch as their primary responsibility is to support movement through the air, it should be possible to characterize this function as a four by four matrix of relations--representing structural inter-similarities, actual movement, shared motions over time, etc., etc. Such a matrix should again be interpretable in entropy maximized form as a symmetric set of relations, if I am generally correct.
Not being a physicist or engineer, however, I haven't a clue as to where to start in that direction. There is another angle, however, that more easily can be looked into, concerning the color patterns on their wings.
It is generally believed that the color patterns on the wings of butterflies have not evolved, at least in the main part, randomly, without reason. The most commonly considered reasons for their particular patterns include provision of camouflage among vegetation, mimicry of noxious species to the end of obtaining some protection from predators, and the generation of various elements facilitating recognition (either by themselves, or by other species). In any case, and for whatever reason we might be dealing with, the expectation here is that function must also be limited by the constraint of producing a pattern which occupies space: and therefore, if we are correct here, must be interpretable through the four-class entropy maximization model we are entertaining.
That said, quite a few obstacles confront analysis of the situation. A butterfly at rest on a surface is close to being a two-dimensional surface, though not perfectly so. Further, even when the organism's four wings are displayed in near two-dimensionality, there is some overlap of them which results in part of the surfaces being concealed. Importantly, moreover, in the vast majority of cases there are not four neatly developed colors that one can associate with "classes of surface." This is not a problem for the theory itself, as in a three-colored wing two classes of color may be locked into one, or in a five-colored wing two colors may combine to function as one class, but it is a problem for initial model validation.
Still, I decided that it would be worth taking a quick look to see if I could come up with any evidence bearing on the model. To do so, in early 2006 I scanned the internet for a good database including butterfly images, and after finding one (the now apparently defunct http://titohost.itbdns.com/butterfly/) looked through it specifically for five species examples whose wings inequivocably had four well-defined colors on them, and only four. The images were then downloaded to hardcopy, and sampled in a manner analogous to the other data sets I have discussed here. Thus, I ended up with five sets of data (the names of the species involved, as given at the site, were Brassolis rusina, Delias ellipsis, Euxanthe tiberius, Dismorphia deione, and Rhetus dysonii), each one of which was divided up into four sets of sampled locations connected to the respective colors. (See Figure 1 for a pictorial view of one of the codings.) Spatial autocorrelation coefficients were calculated, and then run through the double-standardization program.
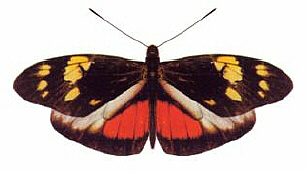
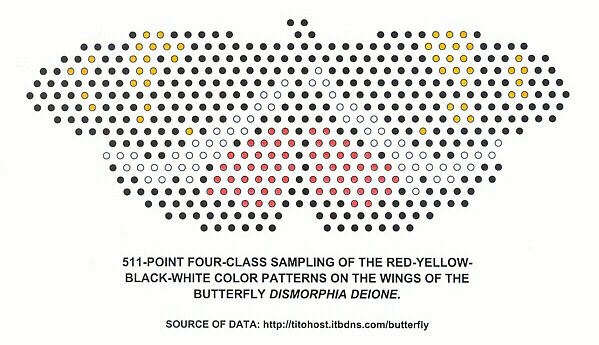
Figure 1. See text for explanation.
For each butterfly, I then created several unnatural alterations of the original patterns by taking five or ten percent of the locations and re-assigning membership to a different class (resulting in some odd-looking, arbitrarily asymmetric, patterns). New spatial autocorrelation coefficients were calculated, and these sets of data also double-standardized--the expectation being that, on the very least, fewer of these aberrations would represent patterns whose resultant double-standardized relations were symmetric.
This was a lot to ask, considering the various sources of error (including some others I haven't mentioned, such as whether the original images on the web were actually truly proportional to the real-life creatures) involved. As it so turned out, modifying only five to ten percent of the class memberships might not have been enough, as it made only small adjustments in the mean correlation values, which often remained low (or even went lower)--and I already know that those matrices sponsoring low mean correlations tend to more frequently double-standardize to symmetric values than those producing high mean correlations.
Again, I used two measures of spatial autocorrelation. The results: For the actual figures, seven of ten outcomes (remember, each of the five patterns were investigated through two spatial autocorrelation measures) produced symmetric double-standardized results, whereas for the contrived, "unnatural" figures, only thirteen of twenty-eight did. The difference in the ratios 7 : 3 and 13 : 15 is probably mildly statistically significant (though one cannot apply a typical contingency table analysis here because one of the four numbers is less than 5). I am also far from confident that I provided an adequate sampling density (a range of 415 to 678 sampled points across the five figures) to capture the essence of the five patterns, some of which included considerable numbers of fairly small spots. Nevertheless, it would appear that in a fairly small amount of time it was in fact possible to identify some apparent differences between the real butterflies and the fake patterns on the basis of this model. It is not particularly troublesome that many of the fake patterns produced symmetric results, because the model admits that this is often likely to be the case; it should always be the case, given adequate sampling density and a valid measure of differentiation, however, that the real patterns will return more (all, in theory) such results.
2008 Study
The 2006 results, though by no means decisive in themselves, gave me enough confidence to make an attempt to extend the investigation in early 2008. For this work I employed a slightly different approach.
I already know from earlier simulations that: (1) generally speaking, data matrices the mean values of whose derivative correlation matrices approach zero are more likely to double-standardize into the symmetric form sought after here; and (2) the number of points randomly sampled (and grouped into classes similarly) on various two-dimensionally enclosed shapes has little effect on such systems' tendency to double-standardize into the same kind of symmetric outcome (see Table 1 in the earlier essay in this series). However, it does appear, based on my experiences with the earth system and stream drainage basin systems discussed earlier, that the more completely (densely) real world systems are sampled in this fashion, the lower falls the mean correlation index value, and the more frequently double-standardization produces symmetric outcomes. Given this knowledge, I decided to re-perform the butterfly wing analyses, this time applying sampling grids that were, respectively, one-ninth as dense, and four times as dense. In theory, and if butterfly wings do in fact exhibit the kind of pattern structures I am anticipating, poorness of results in the sense described should decrease as sampling density is increased.
Again, I was under no illusions, considering the number of sources of error involved as discussed earlier, that perfectly defined results would be obtained. Still, the system constraints on the outcomes for this kind of structure (at least, as suggested by the simulation studies) appear not to be so severe that a decided trend, if there, should be concealed.
As the time I can devote to such exploratory work is limited (and manual sampling was again to be employed), I performed only the following operations, beginning with the same five samples taken in the 2006 analysis: (1) two different samplings from each butterfly image at one-ninth the original grid densities; (2) one additional sampling from each butterfly image at the same density as the original (2006) sampling grids; and (3) one sampling from each butterfly image at four times the grid density as the original (2006) sampling grid. A fourth step (intermediate between 2 and 3) was also achieved by using a combination of #2 above and the original data itself to produce a sampling density at twice that of the original.
The results, as depicted graphically in Figure 2 and Figure 3 below, are strikingly in accordance with the projected outcomes. In each graph, results are presented for the above set of studies, run through both spatial autocorrelation index models (coded blue and red); it is apparent that the overall model is robust enough to accommodate both measurement forms.
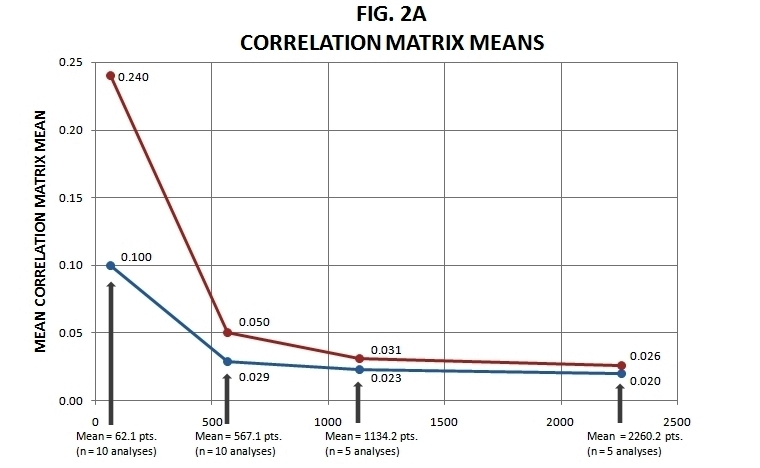
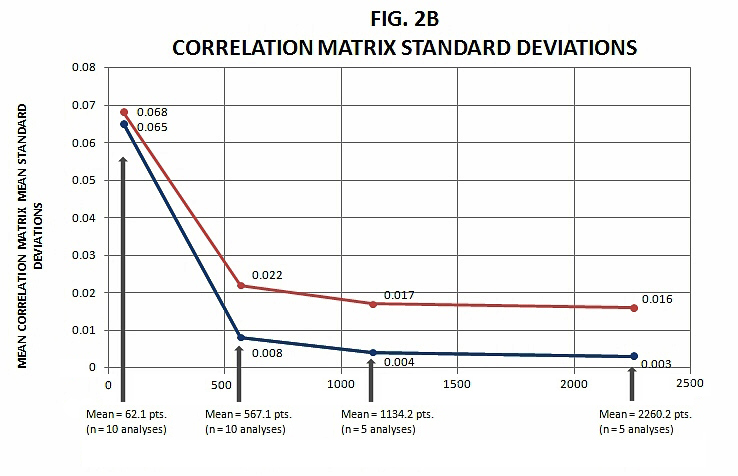
Figure 2. Mean Correlations Summary (see text for explanation).
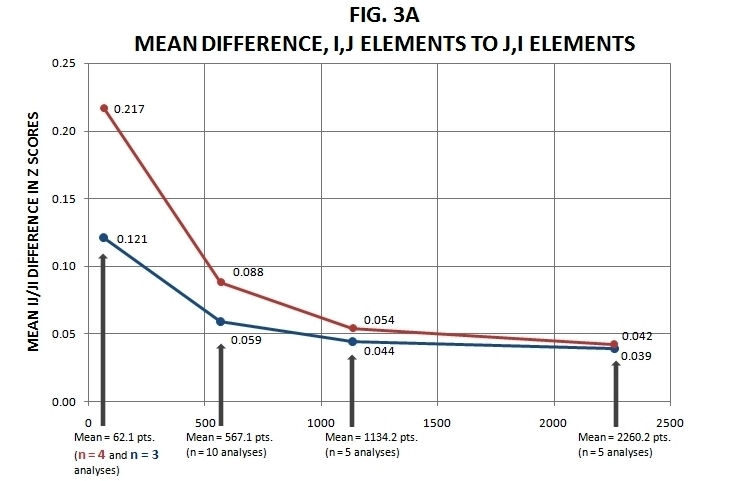
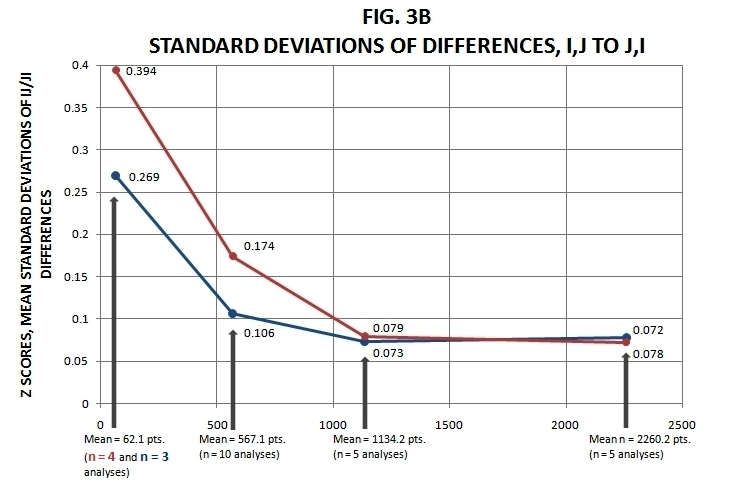
Figure 3. Mean i,j / j,i Differences Summary (see text for explanation).
In Figure 2a, the eight means of the sets of correlation matrix means are presented (in total, 20 + 20 + 10 + 10 = 60 individual analyses are summarized). As sampling density increases, so too decreases the mean correlation matrix mean, and in a very behaved way.
In Figure 2b, the parallel standard deviations connected to means of the correlation matrices are themselves averaged, and graphed. What this indicates is that across all the 4 by 4 correlation matrices compiled from the original spatial autocorrelation values, the summary column means of these, beyond merely averaging out to a lower number as sampling density increases, vary in range of value (above and below zero) less as well.
In Figure 3a is graphed parallel means for the differences between the ij and ji standardized values in the double-standardized z scores matrix. Now in theory, and given improvements designed to reduce measurement error, these values should all converge toward zero (because of the symmetric nature of the matrix anticipated here). Here, however, I have deliberately introduced suboptimal sampling densities to try to make the point that with denser sampling the process appears to be converging toward values of zero, which it clearly seems to be doing. A couple of notes are in order.
First, the mean values for the n = 62.1 points (i.e., the average density of points across the ten one-ninth of original samplings) conditions are based on only four and three of the analyses, respectively, for the two spatial autocorrelation measure models. This is due to the fact that the rest of the analyses produced double-standardized results departing so far from a potentially symmetric condition that this means of summary could no longer be justified. However, this concession to conservative reporting only means that the values plotted would be in some fashion considerably larger if the rest of the analyses were taken into account.
Second, while it is true that only just short of one-half of the rest of the analyses produced double-standardized outcomes that were truly symmetric, the amounts of deviation from zero ij / ji difference were relatively small on the average to begin with, and only got smaller as sampling density increased. In these analyses, the resulting z scores range in value from about 1.7 to about -1.3, thus a mean difference of roughly .04 between ij and ji elements (as was the case for the mean n = 2260.2 points analyses) indicates a fairly small difference given the magnitude of the values (for example, the difference between an ij value of .960 and a ji value of 1.000). Note in this context that the simulations I performed on arbitrarily bounded two-dimensional shapes that involved random sampling produced double-standardized results with mean ij / ji element differences several times as large, even including the ones (approximately ten percent in number, and differing little among individual simulations) that did double-standardize to symmetry.
In Figure 3b I again graph the accompanying mean standard deviations. For data that double-standardize to symmetric results, the standard deviation of the ij / ji differences will be zero of course, just like the mean. However, as soon as some of the ij / ji differences are greater than zero, the standard deviation will increase. In Figure 3b we see, as in Figure 2b, a general (though not quite perfect) reduction in values as sampling density increases. Thus, the range of ij / ji differences in the coarser samplings is much greater than in the finer samplings (the slight discrepancy within the latter two probably due to error, including the small number of cases investigated). This was not so for the arbitrarily bounded two-dimensional shapes I applied varying sampling densities to (i.e., involving 20, 30, 45, 60, 100 and 405 points) in past simulations; the results for these varied little among all of the analyses.
I have not put together graphs paralleling the results shown in Figure 2, but based on the other measure of internal system equilibrium I mentioned earlier: using the absolute values of the means of the vectors in the correlation matrix instead of the means themselves, which otherwise run to both positive and negative values away from zero. This second measure captures not only the degree of overall system imbalance, but of sum deviation from zero, on a by-vector basis. I did however calculate the parallel means (to 2A) and standard deviations (to 2B), and the results show just as clear a convergence, and for both spatial autocorrelation models.
Despite the fact that only five butterflies were studied in the fashion described, it seems quite likely on this basis that the wing patterns involved really do fit the model. Beyond the clear pattern of approach to the theoretical position exhibited by the samplings, it must be remembered that less than ten percent of the random samplings--at various densities of sampling, and for several different two-dimensional shapes--attained the symmetric double-standardized condition.
2009 Study
In an effort to expand on the original 2006 results, I have performed an additional series of spatial autocorrelation analyses on the wing color patterns using the finer grid-based samplings performed in 2008 (which as just mentioned above produced an average of 2260.2 sampled points, across the five butterflies). This proceeded as follows.
First, the data were arranged into a vector according to the actual classifications performed in 2008; that is, first by class inclusion, and secondarily (that is, within each class) according to x-y coordinate. The number of elements in each class, for each butterfly, was known a priori from the original classifications. The spatial autocorrelation algorithm reads in the vector of data line by line and sequentially assigns class membership on the basis of what it is told regarding the number of elements there are in each class. Thus, if there are 1800 points in the vector and there are 600 points in class one, 500 points in class two, 400 points in class three, and 300 points in class two, the read statement will directly reflect this to partition the vector properly. What I did in this follow-up analysis was to read in the data in the same order, but assign class memberships according to all permutations of order of the four values. So, and for example, I might now end up with 400 points in the first class, 600 in the second, 500 in the third, and 300 in the fourth--which means a good number of the sampled points will end up in a different class as compared to the original analysis. This of course leads to different class-specific patterns, and different results when these are investigated via spatial autocorrelation analysis.
For any four-class system, there are twenty-four permutations of order of point numbers possible, including the actual (original) classification. So, the patterns of twenty-three could be compared against each actual classification. This leads to a total of 115 such altered classifications, across all five butterflies.
The point of doing all this was to determine whether such arbitrary shifts away from the actual patterns would lead to changes in the spatial autocorrelation measures. Again, my simulations have shown that there is a distinct negative correlation between those matrices that when double-standardized yield low summary internal redundancy measures (the mean correlation values I have been looking at), and the number of such matrices that pass the "spatial projection" test. It is a fair guess that arbitrary shifts away from "real world" patterns (which ostensibly the butterfly wing color patterns are) will tend to produce more results which are "unnatural" and both pass the spatial projection test less frequently, and generate larger internal redundancy values.
This indeed happened when I applied a similar test to the stream systems data, reported in the "Real World Studies II, Part B" essay in this series. The butterfly wing pattern data I have, however, are more error prone than the elevations data, as already discussed. Because of this, there seemed little point to examine the number of "passes" of the spatial projection test, and instead concentrate on the internal redundancy measures.
I investigated the patterns using three different spatial autocorrelation algorithms, including the one which in all the other analyses had produced the clearest results. In this instance, two of the three measures yielded results that were inconclusive. The third one, however, as in the other analyses, revealed distinct differences between the "actual" analyses, and the contrived ones: 78 of the contrived systems showed a higher redundancy value using the "mean correlations" redundancy measure, whereas only 36 showed lower values; meanwhile, 70 of the contrived systems showed a higher redundancy value using the "mean of absolute values of mean correlations" measure, while 45 showed lower ones. The hypothesis that the mean values should not differ from those obtained in the actual analyses can be rejected at a significance level of nearly zero.
Again, it should be understood that many of the arbitrary patterns thus produced may well represent possible actual patterns. Just because they may be possible in an absolute sense doesn't necessarily mean that there is any sequence of sustainable possible patterns that will lead to the outcome--a point with many imaginable ramifications.
Final Comment
Supposing for the moment that the model I have developed turns out to have both descriptive and causal implications, this leaves us with an interesting question. It is strongly supposed that the color patterns on the wings of butterflies have adaptive function; I do not dispute this. However, it is worth considering, in view of the findings described at this site, whether the color patterns we witness on the wings of the mimicked species are due to causes external to the organism, internal to it, or both. In the first instance, the patterns may be supposed to have emerged as a result of selection for camouflage, or warning, or in any case some function connected with the protection of the organism. In the second case, on the other hand, it is possible that the genetic, developmental, and physiological contributions to outcome are in various ways constrained to produce only a certain range of kinds of outcome, pattern-wise. I am not certain that we possess means of study at this point that could lead us to support one or the other mechanism, but we probably do have the means to study the architecture of individual molecules (whose potential range of manifest structure should, on the model presented here, face analogous restrictions on expression). Amino acids, most of which are comprised specifically of combinations of the elements H, C, N and O, seem good initial candidates for such investigation. Such work could lead to significant implications within the realm of designability.
_________________________
Continue to Next Essay
Return to Writings
Menu
Return
to Home
Copyright 2006-2014 by Charles H. Smith.
All rights reserved.
Materials from this site, whole or in part, may not be reposted or otherwise
reproduced for publication without the written consent of Charles H. Smith.
Feedback: charles.smith@wku.edu
http://people.wku.edu/charles.smith/once/butterfly.htm