The
Once and Future Wallace
Real World Studies V: The Indianapolis, Indiana Region.
Back
in the late 1970s I started an intensive study of the human population
growth patterns within the Indianapolis region, an area encompassing roughly
the "middle" two-fifths of the state of Indiana. After defining
the region limits on the basis of the bordering hinterland cities between
Indianapolis and similar level function large cities in surrounding states,
I began looking (as many others have) at how this particular region had
developed since its first days early in the nineteenth century (although
the overall region had largely been settled by then, Indianapolis itself
was founded in 1821 and officially was made the state's capitol in 1825--but
it was a decade or two before the city was large enough to have a dominating
influence in central Indiana).
At the time I was primarily interested in seeing whether the patterns of growth in the area could suggest some refinements of what geographers refer to as "Central Place Theory," a conceptualization of the way hierarchical economic forces shape the development of regional structures over time. My particular approach was to try to move away from the analysis of interactions between individual places within the system (as was commonly being done at the time using the entropy maximization methods developed by mathematician/geographer Alan Wilson in England, and others), and instead to concentrate on the interactions among classes of places, grouped by size. I was already wondering whether it was actually the a priori development of such classes that dictated regional system evolution, though at that point I was looking at the question from a philosophical position I later rejected.
Despite the fact that this is one of the most ideal regional areas on earth for such studies (having had a fairly short history, and lying within a physical expanse uninterrupted by any major water or topographical barriers), a fairly daunting initial problem presented itself: although U. S. Census data existed for the whole history of the area, the basic township units that covered it were not quite satisfactorily constant in area over the whole expanse of the region (for example, too many larger-than-average townships existed in the southwestern quarter of it). It was therefore necessary to do some lumping and splitting of the initial units until roughly the same average size of fundamental units prevailed across all quarters of the region (less than ten per cent of the results were affected, largely in uniformly rural areas).
I might have stopped there, before performing various analyses, but reasoned that it would be preferable to make use of a further assumption: that not only were the township units of the same average size from one portion to another of the region, but that they were exactly the same size. This meant having to develop a mathematical function that could realistically increase the absolute population of units that were below the average township area, and conversely decrease those that were above it (in effect, resetting the immediate township boundaries a mile or two to "even out" their sizes). This was not easy, as ambient densities decay at different rates, spatially, away from centers of varying size. At last, however, a single though somewhat complicated transformation equation was arrived at which left the sum of all the 387 townships' adjusted populations deviating no more than 0.1 % from the actual totals in any of the 1860-1980 census years, and that produced realistic adjustments at the level of each individual township in each census year. [*Regarding the sum of the absolute values of the differences between the estimates and the actual for any given census year... This varied little in absolute number value from year to year, but dropped steadily as a proportion of the total actual population between 1860 and 1980: from 22 percent in 1860, to 5.6 percent in 1980. This makes sense, as almost all the adjustments took place in rural areas, which formed a much bigger percentage of the region's total population (585,367) in 1860 than in 1980 (2,541,486).]
I next took the resulting thirteen sets of 387 adjusted populations and subjected each set to the same nonhierarchical clustering algorithm discussed in the stream drainage basins analysis. Specifically, for each set the solutions consisted of splitting the population sizes up into two through six classes of population size. Figure 1 shows two of these systemizations, the four- and five-class classifications for the 1970 data.
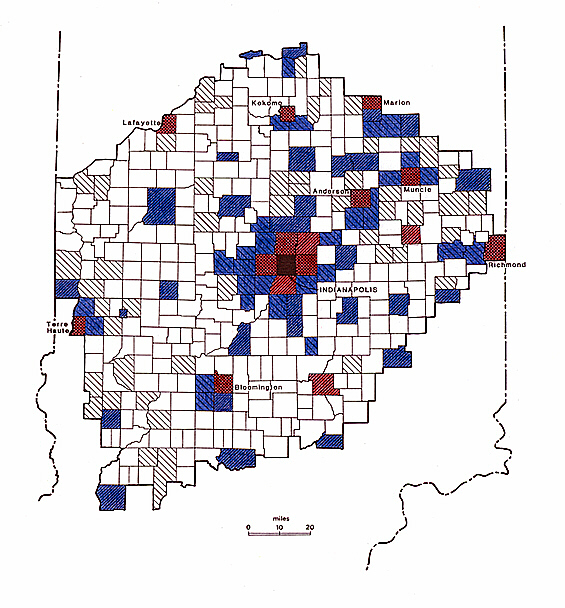
Figure 1. The 1970 data classified into four size ranges: black (for central Indianapolis only), red (for small cities and large suburbs), blue (for medium-sized towns and suburbs), and colorless (for rural areas and small towns). The colors-keyed classification is superimposed over a five-class classification of the same data distinguished by hatching patterns.
As
with the other data sets already discussed, I had hoped to look at the
class-level spatial autocorrelation patterns next. A major problem emerged,
however: in almost all of the classifications a single place--Indianapolis
itself--ended up being assigned to the largest population size class.
This made calculating its spatial autocorrelation (and gravity and population
potential) properties an issue, as the 1,1 element in the matrix of relationships
describing inter-class relations could only describe it, relative to itself.
I never really solved this problem (perhaps a more talented mathematician
than I am will have better luck).
In any case, the populations at particular locations within the region act, in calculation terms, very much like the sampled elevation locations do within the stream basins: in each case, variations in value/level mean variations in potential for interaction. Indeed, there is a term called "population potential" in geography which describes mathematically, over space, how a given center's population "mass" creates a potential for interaction with other such masses, and how that function of potential weakens the further removed one is from the center. Once the "1,1" problem is overcome, matrices describing group- (class-) level potentials could be constructed, and then double-standardized.
I did try some such analyses using various estimates for the 1,1 value, and initial results suggest that the four-class partitions from the earlier years of the region do in fact double-standardize to the symmetric pattern looked for here (for the same reason as in the other analyses), but that starting around 1950 they no longer do. If this bears out under future examinations, I offer the following possible explanation.
For the earlier years, it could be safely assumed that the pattern of resident populations was essentially equivalent to the pattern of population potential because almost everyone actually worked very close to where they lived. Starting with the post-World War II trend toward relocation of city dwellers to the suburbs, this was no longer true; i.e., the variable "residence" no longer represented the same system-defining force it had previously. Instead, and from the point of view of system organization, the more significant factor was where we worked, or perhaps both where we resided, and where we worked.
Nevertheless, I have some other evidence that the adjustments to the raw data have resulted in a clearer picture of overall regional system organization--and that this is, in fact, dominated by an a priori kind of organization revolving around the partitioning of flows and potentials into a four-class structure of inputs and outputs. Two things make me think so.
If one standardizes all of the adjusted populations such that their new "populations" now represent a proportion of that year's total regional population, and then uses these figures to calculate gravity/population potentials across all town to town interactions in the region, one comes up with figures that when totalled can be compared from census year to census year for the system as a whole. In the present instance there is in fact a continuous increase from census to census in the sum gravity/population potential for the system, all the way through 1980. This means that there has been a directional movement throughout the life of the system to locate individual people in such a fashion as to minimize the mean distance from all persons to all persons. To accomplish this, the system has described a complex clustering process that seems to cut across all other trends (urbanization, suburbanization, etc.), suggesting some overriding principle of organization in effect.
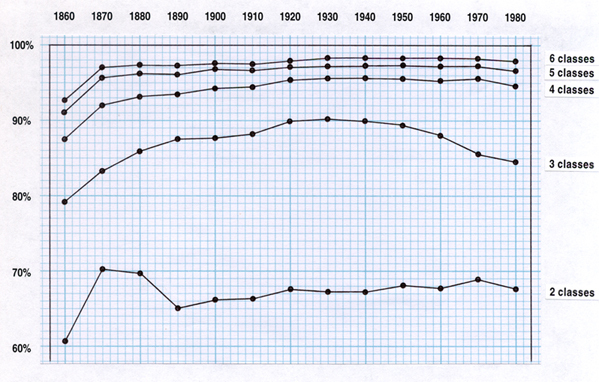
That such a principle has been operating, and that it is related to the evolution of a four size-class set of internal relationships, is more directly suggested by the degree to which the four-class solutions for each set of data 1860-1980 dominate, at least with respect to percentage of variation explained. The overall trends of explanation in the two- through six-class classifications of the data are indicated in Figure 2, which precisely graphs census year against proportion of total variation explained.
Generally
speaking, the mere expansion in number of classes allows for greater partitioning
of the data (in this case the 387 adjusted populations for a given census
year), and an increase in the percentage of the variation explained in
it. For data with no structure--say a perfect rank order structure--the
rate of increase in variation explained from one to many classes will
slow, and at a regular rate of decrease. For data that do contain structure--a
clustering of values at some level, for example--the rate of improvement
from class to class will be irregular, with larger gaps followed by smaller
gaps, etc. Here we have a good example of this. In each census period,
the increase in percentage explanation is considerable between the two-
and three-, and three- and four-, class explanations, but then drops off
markedly between the four- and five-, and five- and six-, class explanations.
This is especially evident in the last three censuses, at a point where
the system has evolved to a rather advanced state of clustering of population.
The way the four-class classification stands out is most evident by calculating the means of improvement in explanation across all thirteen of the periods. The average two-class explanation accounts for 67.14 percent of the variation; an average of 60.18 percent of the remaining 32.86 percent is then accounted for by adding the third class; an average of 55.54 percent of the remaining 13.08 percent is then accounted for by adding the fourth class. Note now that adding the fifth class only accounts on the average for 39.46 percent of the remaining 5.90 percent, and that the sixth class only adds an average of 32.20 percent of the then remaining 3.60 percent. There is thus a considerable gap in this series after the fourth class level (i.e., 67.14 -- 60.18 -- 55.54 -(here)- 39.46 -- 32.20), and this gap is even greater when one examines the 1960, 1970, and 1980 data alone. This strongly suggests that there is something special about the four class solutions here; i.e., that there is something resembling four evenly spread clusterings of values among the 387 elements of the set, taken in order.
This can be examined further and debated at some later point. For the moment these results can be taken as (modestly) supporting the general thesis here regarding the forces underlying organization of complex systems. I don't claim to have proven anything through these data at this point, yet it would appear at the very least that this approach to modeling population change might end up quite useful to the forecasting of future trends in its component parts, since the constraint to both increase population potential across all units, while observing the four-class organizing principle (supposing it exists!), is likely to be a very strong one.
_________________________
Continue to Next Essay
Return
to Writings Menu
Return
to Home
Copyright 2006-2014 by Charles H. Smith.
All rights reserved.
Materials from this site, whole or in part, may not be reposted or otherwise
reproduced for publication without the written consent of Charles H. Smith.
Feedback: charles.smith@wku.edu
http://people.wku.edu/charles.smith/once/indy.htm