
http://people.wku.edu/charles.smith/biogeog/WILL1943.htm
Area and Number of Species
by Carrington B. ('C. B.') Williams (1943)
Editor Charles H. Smith's Note: Original pagination
indicated within double brackets. Notes are numbered sequentially and
grouped at the end, as in the original. Reprinted by permission from Nature
152 (1943): 264-267, Macmillan Publishers Ltd.
[[p. 264]] For many
years there have been discussions of the relation between the size of
a sample of an animal or plant community and the number of species contained
in it. Until recently, however, most of the approach has been from the
botanical side.
So long ago as 1859 Watson1 gave a table of the area and number of species of flowering plants in each of the 18 provinces and 38 sub-provinces into which he divided Great Britain, and commented on the fact that one square mile of diversified country in the north of Surrey contained nearly half the species of plants of the whole 760 square miles of the county. Much later, Willis2 touched on the same problem from a slightly different angle, as he was more interested in the frequency of species with different distributions than with the actual number of species in one area. The question was then taken up by Arrhenius, Gleason and others by the use of the quadrat system of examining very carefully all the plants on a number of quite small areas as a random sample of the whole.
Arrhenius3 considered that the relation between area (A) and number of species of plants (S) on various sizes of plots in the same botanical association was given by the formula A varies as (S)n where n is a constant for the population under consideration. Rich types (that is, associations rich in species) have a low n value and poor types a high value, but the range of n was quite small. This relation should give [[p. 265]] a straight line when the log of the area is plotted against the log of the number of species. On the whole the fit of Arrhenius's calculated figures to the observed numbers was not good, and in some examples, especially for rather large areas, very poor indeed.
Gleason4 studied data from a number of plots of different sizes in an aspen association in Michigan. He came to the conclusion that a straight-line relationship was obtained when the log area was plotted against the actual number of species, and not its logarithm: otherwise that A varies as nS. This gave a distinctly better fit than Arrhenius's figures for larger areas, but when extrapolated towards the smaller areas gives the curious result that certain small areas must have no species--or even less than none!
Both these theories were developed empirically to find a graph to fit certain observed results, and they were not based on mathematical reasoning.
In all the work on plants, the areas have been the basis of comparison between two or more samples. Plants are sedentary, so that it is easy to decide which plants belong to any particular area; and within one ecological association the number of individuals is probably proportional to the area. On the other hand, it is difficult in many species of plants to decide where an 'individual' begins and ends. In animals the reverse is the case; it is nearly always possible to recognize the individual; but, owing to their mobility, it is difficult to say which animals belonged to which area, particularly if this is small.
The problem of the relation between the number of individuals and the number of species in a random sample of a mixed animal population has been recently taken up. R. A. Fisher has developed a mathematical theory of sampling, based on certain assumptions as to the frequency distribution of different species in the population sampled; and I have shown that these conclusions are very closely supported by results obtained in the field by random samples of insects in a light-trap5.
Fisher's work suggests that the relation between the number of species (S) and the number of individuals (N) in random samples of a mixed population is given by
![]()
The value ![]() is a constant for the population and we have called it the Index of Diversity.
It is large for populations rich in species and small for those with few
species, and it has a very considerable range of values in observed samples.
is a constant for the population and we have called it the Index of Diversity.
It is large for populations rich in species and small for those with few
species, and it has a very considerable range of values in observed samples.
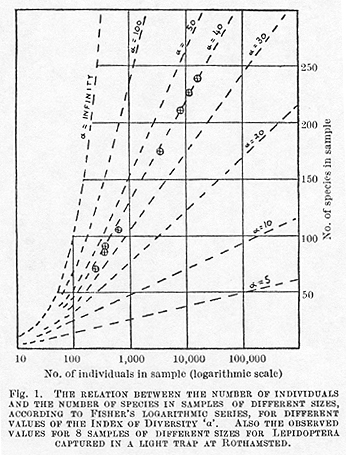
If for any one sample from a mixed population
we know the number of individuals and the number of species, then ![]() can be calculated, and hence we can find how many species would be represented
in any other sized sample from that population. Fig. 1 shows the observed
numbers of species of Lepidoptera in samples of eight different sizes
taken by means of a light-trap at Harpenden during the years 1933-36.
The same diagram shows the calculated relations for various values of
can be calculated, and hence we can find how many species would be represented
in any other sized sample from that population. Fig. 1 shows the observed
numbers of species of Lepidoptera in samples of eight different sizes
taken by means of a light-trap at Harpenden during the years 1933-36.
The same diagram shows the calculated relations for various values of
![]() , and it will be seen
how closely the observed figures are to the calculated values for
, and it will be seen
how closely the observed figures are to the calculated values for ![]() = 40. Even the slight departure from this theoretical curve can be explained
by the fact that sampling covered several years.
= 40. Even the slight departure from this theoretical curve can be explained
by the fact that sampling covered several years.
It will be noted that, in Fisher's formula,
if the size of the sample N is large compared with ![]() ,
then
,
then
the 1 can be neglected in relation to N/![]() and S is proportional to logeN - loge
and S is proportional to logeN - loge![]() .
Otherwise (since loge
.
Otherwise (since loge![]() is a constant for the population) for large samples there is a straight-line
relation between the number of species and the log size of the sample,
just as suggested empirically by Gleason for plants. For smaller-sized
samples, Fisher's formula departs from the straight line and is a much
closer fit to the observed facts (see Fig. 1). Some botanical applications
of this theory are discussed in a paper at present in the press6.
is a constant for the population) for large samples there is a straight-line
relation between the number of species and the log size of the sample,
just as suggested empirically by Gleason for plants. For smaller-sized
samples, Fisher's formula departs from the straight line and is a much
closer fit to the observed facts (see Fig. 1). Some botanical applications
of this theory are discussed in a paper at present in the press6.
This formula gives an apparently sound basis for calculating the relation between the number of species and the size of the sample (either as numbers of individuals or as area) provided that the samples are taken from the same population in the same ecological association. If, in the course of increasing the size of the sample, we extend into a different population or ecological area the number of species will increase more rapidly.
It occurred to me that it would be interesting to see what changes in the number of species were in fact found when the size of the sample was increased far beyond the limits of single ecologically uniform populations. As the number of species concerned is likely to be very large, it was necessary to use for the purpose a diagram showing both species and size of samples on a logarithmic scale, although this does not give a straight-line relationship for sampling from the same population. As plant data appeared to lend themselves better for this study, and to be available in greater quantity, it was decided to plot the number of species of flowering plants against the area sampled over the greatest possible range of areas, from very small to very large.
The results of this investigation are shown in Fig. 2. The heavy central vertical line of the diagram represents one square kilometre of land: to the left
[[p. 266]]
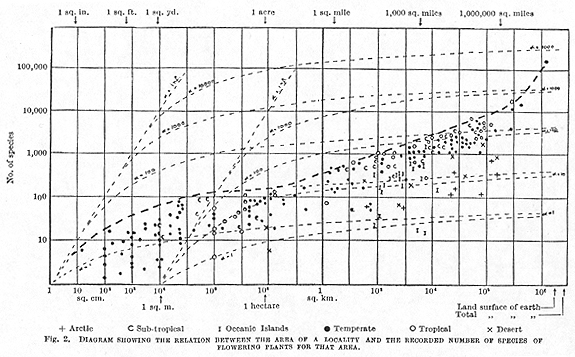
from this the vertical lines represent 1/10, 1/100, etc., of a square kilometre until we reach 1 square centimetre on the extreme left. Moving to the right, we have vertical lines representing 10, 100, 1,000, etc., square kilometres until the one at the right overpasses the total area of the earth's surface. The horizontal lines represent 1, 10, 100, etc., species found in the areas under discussion.
Each point on the diagram represents an actual area of land from which the number of species of flowering plants has been recorded. It was not possible to reproduce here a diagram sufficiently large for each point to be identified to its exact location, so instead they have been distinguished into the chief climatic regions with separate indications of oceanic islands and deserts. The points are not quite evenly distributed throughout the range of the diagram: there is a particular lack of records of areas between two acres and a square mile; and I have only been able to find estimates of the total flora for two continents, North America and Europe. There is a lack of records for small areas both from the tropics and in the arctic and sub-arctic climates. Many records could not be used because the exact limits of the area were not well defined. In general there is probably a tendency to underestimate the number of species; but, except in a few areas that have been very little studied, the number likely to be added will make very little difference to the position of the record on the logarithmic scale. An increase of 10 per cent in the number of species will only move the point upward through approximately its own diameter.
Superimposed on the diagram by dotted lines
are the lines of increase of number of species with size of sample expected
by Fisher's theory of randomized sampling in a uniform population (loc.
cit.). This theory depends on the number of individuals in the sample,
and while in general the number of individual plants is proportional to
the area sampled, this is not true when we compare grassland with woodland,
or woodland with desert or arctic conditions. Available information indicates
that there is about 1 plant per square cm. in temperate grassland, about
1 per square metre in woodland, and 1 per 100 square metres upwards in
semi-desert areas. The relations on Fisher's series are shown for several
different values of the Index of Diversity '![]() ',
and starting from the base line of 1 plant per sq. cm. and 1 per square
metre. It will be seen that the lines for the same
',
and starting from the base line of 1 plant per sq. cm. and 1 per square
metre. It will be seen that the lines for the same ![]() values from these two bases gradually approach as the area increases,
and for very large areas the number of species to be expected is not very
different whether the plant population is dense or sparse. In the extreme
case with
values from these two bases gradually approach as the area increases,
and for very large areas the number of species to be expected is not very
different whether the plant population is dense or sparse. In the extreme
case with ![]() = 1 there would
only be about thirty-four species in the whole world with 1 plant per
square metre, and about forty-two with 1 plant per sq. cm. if the whole
world were a uniform ecological association.
= 1 there would
only be about thirty-four species in the whole world with 1 plant per
square metre, and about forty-two with 1 plant per sq. cm. if the whole
world were a uniform ecological association.
Returning to the distribution of the points on the diagram, it will be seen that they are chiefly scattered over a narrow belt across the figure, the upper limit of which can be divided roughly into three parts. First a period of rapid rise steadily falling away, from the smallest areas of a few square inches to about one or two acres, or one hectare. Secondly, a range of steady rise, almost linear, lasting from about one hectare to large continental areas of about five million square miles. Finally, a very rapid rise from the continental areas to that of the whole land surface of the globe.
It seems to me that these three portions of
the limiting curve can be explained as follows. The first part, as will
be seen from the diagram, very closely follows the curve for ![]() = 10 of Fisher's theory with about 1 plant per sq. cm. Otherwise this
portion [[p. 267]] follows the expected increase
in species due to increase of size of sample within a uniform population,
or within a single ecological association. In other words, up to areas
of the order of one or two acres, neither the climate nor the rest of
the environment changes very rapidly on an average. As soon as we pass
beyond this limit we begin to include new ecological conditions in our
sample, with the result that the number of species will increase more
rapidly than would be expected if the population sampled remained uniform.
This is the second portion of the curve, and the increase of species continues
steadily as we increase the size of samples, gradually including more
and more variety of ecological formation due either to climate, soil,
slope or other differentiating cause. This process continues until we
reach the approximate limits of the continents. The slope of this linear
portion of the boundary is such that an increase of 1 in the log number
of species corresponds to an increase of about 5 in the log area. Otherwise
it appears, empirically, that over this range the optimum number of species
increases approximately as the fifth power of the area; to double the
number of species the area must be increased by thirty-two times.
= 10 of Fisher's theory with about 1 plant per sq. cm. Otherwise this
portion [[p. 267]] follows the expected increase
in species due to increase of size of sample within a uniform population,
or within a single ecological association. In other words, up to areas
of the order of one or two acres, neither the climate nor the rest of
the environment changes very rapidly on an average. As soon as we pass
beyond this limit we begin to include new ecological conditions in our
sample, with the result that the number of species will increase more
rapidly than would be expected if the population sampled remained uniform.
This is the second portion of the curve, and the increase of species continues
steadily as we increase the size of samples, gradually including more
and more variety of ecological formation due either to climate, soil,
slope or other differentiating cause. This process continues until we
reach the approximate limits of the continents. The slope of this linear
portion of the boundary is such that an increase of 1 in the log number
of species corresponds to an increase of about 5 in the log area. Otherwise
it appears, empirically, that over this range the optimum number of species
increases approximately as the fifth power of the area; to double the
number of species the area must be increased by thirty-two times.
When we add continents together to get the flora of the whole world, an entirely new factor comes in, that of the evolutionary origin of the floras. Fewer species are common to two continents than to two halves of the same continent. The floras have evolved differently. Therefore, on adding two continental areas together we get a sudden increase on the number of species, far beyond that due to the increase of ecological variety within the area. This is the last steep portion of the curve.
Thus the inverted S-shaped form of the boundary of the belt of points appears to be consistent with the known facts of sampling technique, ecology and evolution.
The position of the points within the belt can be used for pointing out resemblances and differences which may be of great interest. It will be seen, as might be expected, that the tropical and sub-tropical areas have in general rather more species on the same areas, but the temperate areas run them very closely. On the other hand, the lower portion of the belt is largely made up of floras of either arctic areas, deserts or oceanic islands. The two isolated 'I's' between 103 and 104 square kilometres are Kerguelen Island and South Georgia, both oceanic islands with, in addition, a sub-arctic climate. If a much larger number of points could be obtained it would be of interest to tabulate each type of climate separately--and possibly to distinguish some of the different associations, such as forest and steppe, which cover large areas.
It is possible from this type of diagram to make rapid comparisons between areas of similar size with different numbers of species, and between areas with the same number of species but different sizes; and new areas can be placed on the diagram and rapidly assessed in relation to those already known.
This enables one to take in a comprehensive view of a range of phenomena which has been insufficiently studied; and also makes it possible to make rapid comparison between the richness of flora of different areas, at the same time allowing for the differences in size. Up to the present it has been easy to compare floras of similar areas but very difficult if they were dissimilar.
I should be glad of any data of area and number of species for other localities so that the diagram can be made more complete and later republished on a much larger scale.
Notes (in the original work, these appeared as listed below, at the very
end of the article)
1. Cybele Britannica, 4,
379 (1859).
2. "Age and Area" (1922).
3. Ecology, 4, 68, 90 (1923).
4. Ecology, 6, 66 (1925).
5. Fisher, Corbet and Williams, J. Animal Ecol.,
12, 42 (1943).
6. Williams, C. B., J. Ecol., 31
(1943), in the press.
*
*
*
*
*