http://people.wku.edu/charles.smith/biogeog/MERR1894.htm
Laws of Temperature Control of the Geographic
Distribution of Terrestrial Animals and Plants1
by C. Hart Merriam (1894)
Editor Charles H. Smith's Note: An annual address
by Merriam, then the Vice-President of the National Geographic Society.
This is perhaps Merriam's most succinct summary of his "life zones" model.
Original pagination indicated within double brackets. Notes are numbered
sequentially and grouped at the end, with the page(s) they originally
appeared at the bottom of noted within double brackets. Citation: National
Geographic Magazine 6 (1894): 229-238.
[[p. 229]] The tendency
of animals and plants to multiply beyond the means of subsistence and
to spread over all available areas is well understood. What naturalists
wish to know is not how species are dispersed, but how they are checked
in their efforts to overrun the earth. Geographic barriers are rare, except
in the case of oceans, and since even these were formerly bridged at the
north, another cause must be sought. This has been found in the group
of phenomena commonly hidden under the word climate, and nearly a century
ago it was shown by Humboldt that temperature is the most important of
these climatic factors.
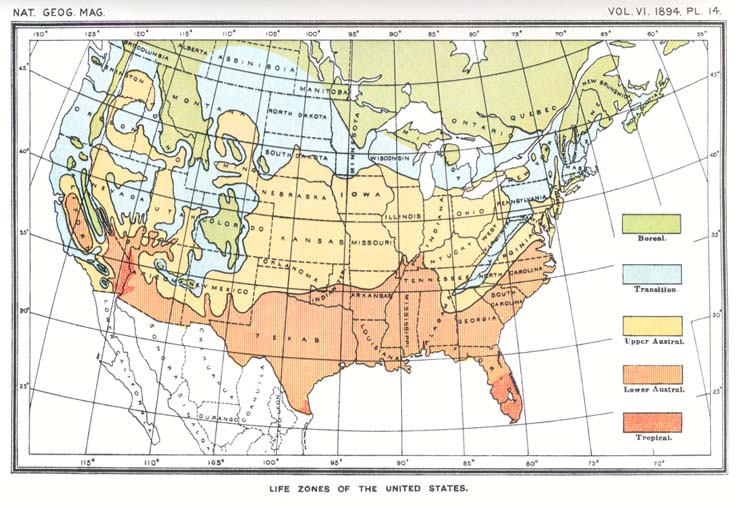
In the northern hemisphere animals and plants are distributed in circumpolar belts or zones, the boundaries of which follow lines of equal temperature rather than parallels of latitude. They conform in a general way, therefore, with the elevation of the land, sweeping northward over the lowlands and southward over the mountains. Between the pole and the equator there are three primary belts--Boreal, Austral and Tropical--each of which may be subdivided into minor belts and areas. In the United States the Boreal and Austral regions have each been split into three secondary transcontinental zones. The Boreal are known as the Arctic, Hudsonian and Canadian; the Austral as the Transition, Upper Austral and Lower Austral. The subordinate faunas and floras need not be here considered.
[[p. 230]] The area of overlapping of Boreal and Austral types is confined in most parts of the country to the narrow Transition zone, but along the Pacific coast it reaches all the way from southern California to Puget sound. This Pacific coast strip has always proved a stumbling-block to students of geographic distribution of life in America, but has now become the means of verifying the fundamental laws governing this distribution, as shown later.
But while the boundaries of the several zones rarely coincide with absolute mechanical barriers, being fixed in the main by temperature, difference of opinion prevails as to the period during which the temperature exerts its restraining influence, and no formula for the expression of the temperature control has been heretofore discovered. None of the temperature data computed and platted on maps as isotherms are available in locating the exact boundaries of the zones, because these isotherms invariably show the temperature of arbitrary periods, such as months, seasons and years--periods whose beginning and ending have reference to a particular time of year rather than a particular degree or quantity of heat. Thus the temperature for July, which is by far the most important of those commonly shown in isotherms, bears an inconstant relation to the hottest part of the year. In certain localities the four hottest weeks may fall within the month of July, but in other localities they cover the period from the middle of June to the middle of July; in others from the middle of July to the middle of August, and in others still from the early part of August to early September. Similarly, the isotherms showing the mean annual temperature fail to conform to the boundaries of the life zones, although in the far south they may be nearly coincident. The mean summer temperature is obviously inapplicable because of the varying length of the season in different localities.
Several years ago I endeavored to show that the distribution of terrestrial animals and plants is governed by the temperature of the period of growth and reproductive activity, not by the temperature of the whole year; but how to measure the temperatures concerned was not then worked out. The period of growth and reproductive activity is of variable duration; according to latitude, altitude and local conditions of each particular locality. In the tropics and a few other areas it extends over nearly the whole year, while within the Arctic circle and on the summits of high mountains it is of less than two months' [[p. 231]] duration.2 It is evident, therefore, that while in the tropics there may be a close agreement between the mean annual temperature and the life zones, in the north the widest discrepancy exists between them.
At one time I believed that the mean temperature of the actual period of reproductive activity in each locality was the factor needed,3 but such means are almost impossible to obtain, and subsequent study has convinced me that the real temperature control may be better expressed by other data.
For more than a century physiological botanists have maintained that the various events in the life of plants, as leafing, flowering and maturing of fruit, take place when the plant has been exposed to a definite quantity of heat, which quantity is the sure total of the daily temperatures above a minimum assumed to be necessary for functional activity. The minimum used by Boussingault and early botanists generally was the freezing point (0° C. or 32° F.), but Marie-Davy and other recent writers believe that 6° C. or 43° F.4 more correctly indicates the temperature of the awakening of plant life in spring. In either case the substance of the theory is that the same stage of vegetation is attained in any year when the sum of the mean daily temperatures reaches the same value, which value or total is essentially the same for the same plant in all localities. This implies that the period necessary for the accomplishment of a definite physiological act, blossoming for instance, may be short or long, according to local climatic peculiarities, but the total quantity of heat must be the same. The total amount of heat necessary to advance a plant to a given stage came to be known as the physiological constant of that stage. Linsser believed this law to be fallacious and maintained that the physiological constant of any particular stage of vegetation was not the sum total of heat acquired that time, but the ratio or proportion of this sum to the sum total for the entire season. Thus Linsser's physiological constant is the ratio of the sum of the mean daily temperatures at the time when any particular stage of vegetation is attained to the sum total for the [[p. 232]] year. This formula was based on the belief that plants of the same species living in different places arrive at the same phase of development by utilizing the same proportion of the total heat which they receive in the course of a season.
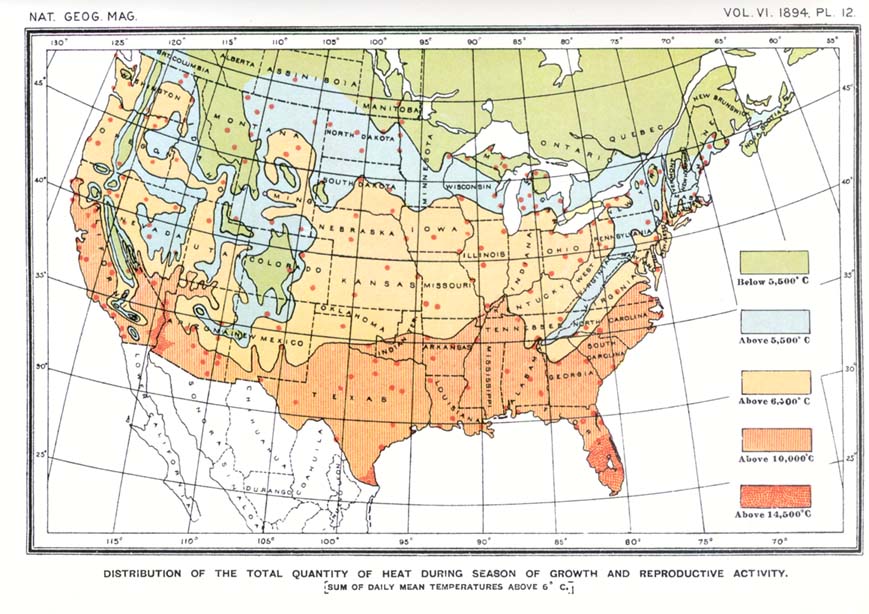
Students of geographic distribution may dismiss this phase of the inquiry as not pertinent to the problem in hand, for we are concerned with the physiological constant of the species itself, not of any stage or period in its life history. But what is the physiological constant of a species, and how can it be measured? If it is true that the same stage of vegetation is attained in different years when the sum of the mean daily temperatures reaches the same value, it is obvious that the physiological constant of a species must be the total quantity of heat or sum of positive temperatures required by that species to complete its cycle of development and reproduction. The difficulty in computing such sums is in fixing the end of the period during which temperature exerts its influence upon the organism. In the case of plants this can be done by direct observation of a particular individual or crop, in connection with careful thermometric readings covering the whole period of vegetative activity, and data of this sort have been actually recorded by certain European phenologists, but I am not aware that an attempt has been made to correlate the facts thus obtained with the boundaries of the life zones. Since, however, all forms of life are affected by temperature and it is manifestly impracticable to ascertain by direct observation the total quantity of heat necessary to enable the various species of mammals, birds and reptiles to complete the annual cycle of reproduction, and since the areas inhabited by definite assemblages of animals and plants have been found to be essentially coincident, it is evident that a more generalized formula is necessary. If the computation can be transferred from the species to the zone it inhabits--if a zone constant can be substituted for a species constant--the problem will be well nigh solved. This I have attempted to do. In conformity with the usage of botanists, a minimum temperature of 6° C. (43° F.) has been assumed as marking the inception of the period of physiological activity in plants and of reproductive activity in animals. The effective temperatures or degrees of normal mean daily heat in excess of this minimum have been added together for each station, beginning when the normal mean daily temperature rises higher than 6° C. in spring and continuing until it falls to [[p. 233]] the same point at the end of the season. The sums thus obtained have been platted on a large scale map of the United States,5 and isotherms have been run which are found to conform in a most gratifying manner to the northern boundaries of the several life zones, as may be seen on comparing a reduced copy of this map (see plate 12) with a map of the life zones (see plate 14). The latter, it may be observed, is identical; save a few corrections in minor details, with the third edition of my Bio-geographic map of North America (prepared a year ago and published in the Annual Report of the Secretary of Agriculture for 1893).6 While the available data are not so numerous as might be desired, the stations in many instances being too far apart, still enough are at hand to justify the belief that animals and plants are restricted in northward distribution by the total quantity of heat during the season of growth and reproduction.7
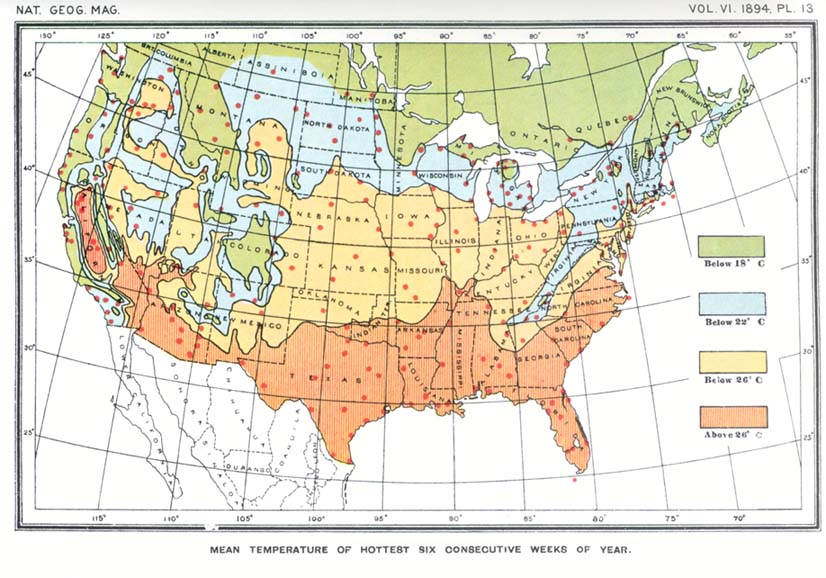
The isotherm indicating a sum total of 5,500° C. (10,000° F.) coincides with the northern limit of distribution of Transition zone species, agreeing in the main with the dividing line between the two primary life regions of the northern hemisphere--Austral and Boreal. But in areas where extensive overlapping of Austral and Boreal types occurs, as along the Pacific coast from southern California northward to Puget sound, it will be observed that the isotherm in question points, as elsewhere, to the northern limit of Austral types and bears no relation whatever to the southward limit of Boreal types. It is evident, therefore, that the southward range of Boreal species, and perhaps of others also, is regulated by some cause other than the total quantity of heat. This cause was believed to be the mean temperature of the hottest part of the year,8 for it is reasonable to suppose that Boreal species in ranging southward will [[p. 234]] encounter, sooner or later, a degree of heat they are unable to endure. The difficulty is in ascertaining the length of the period whose mean temperature acts as a barrier. It must be short enough to be included within the hottest part of the summer in high northern latitudes, and would naturally increase in length from the north southward. For experimental purposes, and without attempting unnecessary refinement, the mean normal temperature of the six hottest consecutive weeks of summer was arbitrarily chosen and platted on a large contour map of the United States, as in the case of the total quantity of heat. On comparing a reduced copy of this map (plate 13) with the zone map (plate 14) it appears that the isotherms conform to the southern boundaries of the Boreal Transition and Upper Austral life zones, and that the isotherm of 18° C. (61°.4 F.) agrees almost precisely with the southern boundary of the Boreal region. The coincidence is indeed so close as to justify the belief that animals and plants are restricted in southward distribution by the mean temperature of a brief period covering the hottest part of the year.
If the isotherm of 18° C. (64°.4 F.) for the six hottest consecutive weeks (see plate 13) is compared with that of 5,500° C. (10,000° F.), showing the sum of positive temperatures (see plate 12), it will be observed that the two are coincident in the main except in a few localities. The principal discrepancy is along the Pacific coast from Puget sound to southern California. In this strip maps 12 and 13 not only fail to agree, but are fundamentally different, showing that no constant relation exists between the mean temperature of the six hottest consecutive weeks and the total of heat for the season. The mean temperature of the hottest part of the year from about latitude 35° northward along the coast is truly boreal, being as low as the mean of the corresponding period in northern Maine and other points well within the Boreal zone. The mean of the six consecutive hottest weeks at several points on the coast of California is as follows: At Eureka, on Humboldt bay, 13°.5 C. (56° F.);9 at San Francisco, 15°.5 C. (60° F.); at Monterey and Ventura, 17°.5 C. (63°.5 F.).10 Strange [[p. 235]] as it may seem, San Francisco has a lower normal mean temperature during the hottest part of the year than Eastport, Maine, the mean at Eastport being 16° C. (61° F.). On the other hand, the sum of positive temperatures (the normal mean daily temperatures above 6° C.) at San Francisco is more than 10,000° Fahrenheit higher than at Eastport, being 11,290° C. (20,360° F.) at the former and only 5.470° C. (9,880° F.) at the latter locality. At no point in the Pacific coast strip is the sum of the positive temperatures known to fall below 7,330° C. (13,600° F.), and it reaches 8,200° C. (14,800° F.) at Tatoosh island, off cape Flattery, the extreme northwestern point of the United States. Even at cape Flattery, therefore, the total of heat for the season is 260° C. (500° F.) greater than at Eastport, Maine, though the latter is the more southern locality and has the higher mean summer temperature.
The data at hand for the Pacific coast strip are amply sufficient to demonstrate two important facts: (1) that the temperature of the summer season, the hottest part of the year, is phenomenally low for the latitude and altitude--so low, indeed, as to enable Boreal types to push south to latitude 35°; (2) that the total quantity of heat (the sum of the positive temperatures) for the entire season is phenomenally high for the latitude--so high, indeed, as to enable Austral types to push north to Puget sound. The total of heat is even greater at Puget sound than at Philadelphia, Pittsburg, Cleveland, Indianapolis, Keokuk, or Omaha, though five hundred miles north of the latitude of these places. In other words, the mean temperature of the hottest part of the year is sufficiently low for Boreal species, while the total quantity of heat is sufficiently great for Austral species.
It is evident, therefore, that the principal climatic factors that permit Boreal and Austral types to live together along the Pacific coast are a low summer temperature combined with a high sum total of heat. The temperature is remarkably equable throughout the year; it never rises high for any length of time, and killing frosts are rare.
The study of the accompanying maps was the means of leading me, first, to the explanation of the anomalous distribution of species on the Pacific coast, where for a distance of more than a thousand miles a curious intermingling of northern and southern forms occurs; and, second, to what I now conceive to be the true theory of the temperature control of the geographic distribution of species.
[[p. 236]] The fundamental laws here developed, phrased for the northern hemisphere, may be briefly formulated as follows:
(1) The northward distribution of animals and plants is determined by the total quantity of heat--the sum of the effective temperatures.
(2) The southward distribution of Boreal, Transition zone, and Upper Austral species is determined by the mean temperature of the hottest part of the year.
ZONE TEMPERATURES.
Boreal Zones.--The distinctive temperatures of the three Boreal zones (Arctic, Hudsonian and Canadian) are not positively known, but the southern limit of the Boreal as a whole is marked by the isotherm of 18° C. (64°.4 F.) for the six hottest consecutive weeks of summer. It seems probable, from the few data, available, that the limiting temperatures of the southern boundaries of the Hudsonian and Arctic zones are respectively 14° C. (57°.2 F.) and 10° C. (50° F.) for the same period.
Transition Zone species require a total quantity of heat of at least 5,500° C. (10,000° F.), but cannot endure a summer temperature the mean of which for the six hottest consecutive weeks exceeds 22° C. (71°.6 F.). The northern boundary of the Transition zone, therefore, is marked by the isotherm showing a sum of normal positive temperatures of 5,500° C: (10,000° F.), while its southern boundary is coincident with the isotherm of 22° C. (71°.6 F.) for the six hottest consecutive weeks.
Upper Austral species require a total quantity of heat of at least 6,400° C. (11,500° F.), but apparently cannot endure a summer temperature the mean of which for the six hottest consecutive weeks exceeds 26° C. (78°.8 F.). The northern boundary of the Upper Austral zone, therefore, is marked by the isotherm showing a sum of normal positive temperatures of 6,400° C. (11,500° F.), while its southern boundary agrees very closely with the isotherm of 26° C. (78°.8 F.) for the six hottest consecutive weeks.
Lower Austral species require a total quantity of heat of at least 10,000° C. (18,000° F.). The northern boundary of the Lower Austral zone, therefore, is marked by the isotherm showing a sum of normal positive temperatures of 10,000° C. (18,000° F.). A formula expressing the temperature-control of its southern boundary has not yet been found.
[[p. 237]] Tropical species require a total quantity of heat of at least 14,400° C. (26,000° F.); and, since the Tropical Life region is a broad equatorial belt, it is probable that both its northern and southern boundaries are marked by the isotherm showing a sum of normal positive temperatures of 14,400° C. (26,000° F.).
An interesting fact respecting the relative values of the zones is brought out by the isotherms showing the total quantity of heat necessary for each. It appears that the Transition and Upper Austral zones are not of equal value, but that together they are the exact equivalent of the Lower Austral zone.
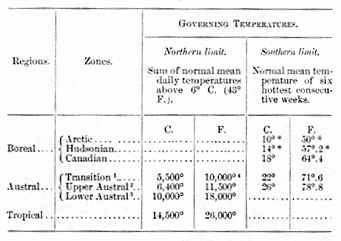
*Estimated from insufficient data.
1The Transition zone comprises three principal subdivisions: an eastern or Alleghenian humid area, a western arid area, and a Pacific coast humid area.
2The Upper Austral zone comprises two principal subdivisions: an eastern or Carolinian area and a western or Upper Sonoran area.
3The Lower Austral zone comprises two principal subdivisions: an eastern or Austroriparian area and a western or Lower Sonoran area.
4The Fahrenheit equivalents of Centigrade sum temperatures are stated in round numbers to avoid small figures of equivocal value.
SECONDARY CAUSES AFFECTING DISTRIBUTION.
It is not the purpose of the present essay to discuss the secondary causes affecting distribution. At the same time it seems desirable to contrast for a moment the influence of humidity, which is by far the most potent of the secondary causes, with that of temperature, which has been shown to be the primary [[p. 238]] controlling cause. Humidity governs details of distribution of numerous species of plants, reptiles and birds, and of a few species of mammals, within the several temperature zones. Thus the palmetto, the green chameleon, the chuck-wills widow and the ricefield mouse inhabit humid parts of the Lower Austral zone (the Austroriparian area), while the mesquite, the leopard lizard, the sickle-billed thrashers and the four-toed kangaroo rats find their homes in arid parts of the same zone (the Lower Sonoran area).
That humidity is less potent than temperature as a controlling factor in distribution may be shown in several ways. The numerical evidence I have given on a previous occasion.11 Equally convincing is the circumstance that many genera restricted to particular conditions of temperature range completely across the continent, inhabiting alike the humid and arid sub-divisions of their respective zones; but no genus restricted to particular conditions of humidity ranges north and south across the several temperature zones.
Humidity and other secondary causes determine the presence or absence of particular species in particular localities within their appropriate zones, but temperature predetermines the possibilities of distribution; it fixes the limits beyond which species cannot pass; it defines broad transcontinental belts within which certain forms may thrive if other conditions permit, but outside of which they cannot exist, be the other conditions never so favorable.
EXPLANATION OF MAPS.
The temperature maps show the isotherms that conform to the boundaries of the life zones and the data on which they are based. The spots show the actual positions of the temperature stations.
In map 12, showing the distribution of the sum of effective temperatures, the isotherms conform with the northern boundaries of the life zones (as shown on map 14) as follows: The isotherm of 14,500° C. conforms with the northern boundary of the Tropical; of 10,000° C. with that of the Lower Austral; 6,400° C. with that of the Upper Austral, and 5,500° C. with that of the Transition.
In map 13, showing the normal mean temperature of the six hottest consecutive weeks, the isotherms conform with the southern boundaries of the life zones (as shown on map 14) as follows: The isotherm of 18° C. with the southern boundary of the Boreal; of 22° C. with the southern boundary of the Transition, and 26° C. with the southern boundary of the Upper Austral.
[[unnumbered page]]