Understanding
Scores
Overview
- Review
types of scores
- Consider
standards for comparison
What types of scores are
there?
- Raw Scores
- Linear Transformed Scores
- Area Transformed Scores
- Stanines
What good are they?
The
Raw Score
The
Raw Score is a simple count of the test behavior, (e.g., # of free throws).
It isn't usually meaningful for psychological measures. If I say you have
a score of '4,' is that good? Bad? Indifferent?
You
can't know anything from a simple total. It may sound like a lot or a
little, but without knowing how it relates to other information, it is
useless. |
 |
| So
we transform it. |
 |
Transformation
- Doesn't
change the score, it just uses different units. (Sounds contradictory?
wait and see how it works).
- Transformation
includes or takes into account information not in the raw score (such as the
# of items on the test).
- More
informative/interpretable than a raw score.
Linear
Transformation
Uses the
linear equation for the transformation.
Examples:
- z
score, mean = 0, sd = 1
- Useful
to psychometricians but not for interpretation to lay public because half
the scores are negative and often fractional. The public thinks a -.01 is
an awful score when really it is average.
- so transform
the z scores again to...
- T
scores, mean = 50, sd = 10
- IQ
scores, mean = 100, sd = 15
- You
can pick the mean and sd you like and convert the z to whatever scale
you want. But the T and the IQ score are the most common.
So how are these used?
Well, if you know an IQ
is 100, you know that person earned a score at the mean of everyone who takes
the test.
If the IQ score is 115,
you know the person is noticeably above the mean (1 standard deviation= 15.
see above).
If 130, much more noticeably
above the mean--definitely an unusual score because it is 2 standard deviations
from the mean.
How unusual a score is 70?
70 is as unusual as which, 115 or 130?
|
130-- they're both
2 standard deviations from the mean.
Suddenly, by using
a linear transformation, the number now has meaning! It tells the unusualness/commoness
of a score just by knowing the chosen mean/sd and the score.
|
 |
Area
Transformation
Uses the
normal curve to create transformations. An area transformation is where on the
curve the score falls, e.g., percentiles (NOT equivalent to percent
or percentage).
55th
percentile: earned score equal to or greater than 55 percent of the people
who took the test. Notice that phrase 'equal to or greater than.' It has to
be exactly that phrase to be accurate.
 |
Percentiles
have uneven intervals�Greatly compressed in the middle�stretched at the
limits. The difference between 50 and 55 percentile is tiny, but the difference
between a 90 and a 95 percentile is huge. Notice that you have to understand
the normal distribution to correctly interpret percentile scores. |
Standard
Nine aka Stanine
- Popular
in education.
- The stanine
divides the normal curve into 9 segments (Middle 20% scorers = 5; next 17%
= 4 or 6; next 12% = 3 and 7; next 7% = 2 and 8; extreme 4% = 1 and 9) [Don't
try to memorize that.]
- Not all
that useful other than it reduces overinterpretation of scores. In
other words, if you tell someone their child had a 72%ile they want to know
why they didn't have a 76%ile or want to claim their Johnny is much smarter
than Billy who got a 69%ile-- the test probably does not support that fine
a distinction. Tell them they had an 8 stanine and that seems to satisfy them.
But
what does the number mean in real life?
Depends
on what you are using for the standard or comparison. That is, a score
is meaningful relative to the comparison on which it is based.
Options
for Standards
Personal
performance - improvement compared to self over time. You may say "I
lift more weight now than I used to."
Useful
in clinical and some educational work. People like this standard when
they are learning--it emphasizes progress made away from the starting
point. |
 |
| |
|
| External
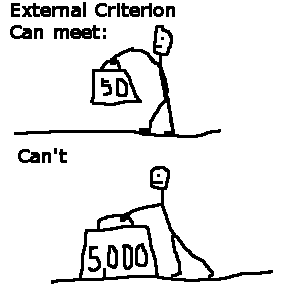
or criterion-referenced. An absolute level of performance must be met
to be successful. External agencies often set criterion-referenced standards.
This one can seem
hard from a learner's point of view. It doesn't matter how hard you tried,
how nice you are, or how much you studied. All that matters is whether
you can remove an appendix without killing the patient or can land a plane
without crashing. |
 |
| |
|
Norm
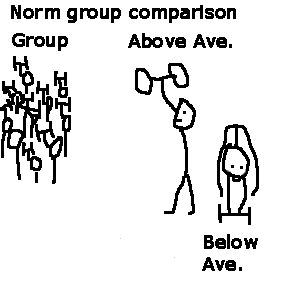
groups- Find out how a group of people do on the test and compare all
scores to their performance. This one is used a lot for psychological
measures because there often is no external criterion.
How
much is enough learning? The norm group answer is "As much as everyone
else is doing." Learners often like this one because it gives them
the security of fitting in. However, they may also rebel at being compared
to everyone else. |
 |
Since norm groups are so
common in psychology, let's explore them a bit further.
Notice that norm groups
are also called "standardization samples". Do you see where the concept
of standard comes into play?
What
group should be used for the norm comparison?
�Depends
on what you want to know. Do you want to know how the person is doing compared
to a sample of peers, e.g., from the same school? or compared to the US population,
e.g., a national group? Do you want to know how they do relative to others their
age? or how they'd fit into an older group?
�The
sample typically is representative
- of the
US population
- of a
particular age
- of a
particular grade or
- Gender,
etc.
But it doesn't
have to fit one of the above categories if you have a specific research or clinical
question, you need a norm group that reflects your question. My mother had a
right hemisphere stroke and I want to know how she is doing. I may want to know
relative to other persons with right hemisphere strokes so we can estimate if
her pace of improvement is "normal", "slower", or "faster"
so we can predict rehabilitation and financial needs.
[Note in
this case that there is also an external comparison to be made and considered--
she can either feed herself or not, toilet herself or not. Meeting those standards
is necessary for independent functioning. It doesn't matter if she is doing
better than the average right hemisphere patient. And relative to herself she
has made tremendous improvement, from being confined to bed to being able to
walk 100 feet with help. This is great, but it may not be enough for that hard
external standard.]
Let's examine
the most popular norms.
Age
norms
Many psychological
traits of interest (e.g., intelligence) change with age so you need a comparison
group of the same age.
Crude example: let's say
that 5 year olds can define "apple" but 4
year olds can't.
If the subject
defines "apple" then she is performing at a "5 year old level"
Grade
Norms
Done similarily
only with grades. They may say a child is performing similar to the beginning
of 3rd grade or similar to the end of 3rd grade.
Typically
they just get a beginning and end of year sample, unless it is first or 2nd
grade, then they may have a middle. (They limit their samples because they'd
have to have a full sample of children for each segment -- it gets costly.)
Big problems
with grade norms though
- "Typical
grade tasks" vary considerably w/schools-- so what does "grade"
mean anyway? What does it mean to be at the beginning of 3rd grade?
- You absolutely
may NOT interpolate (guess at scores between beginning and end of year calculated
ones). Why? Because development is not even or regular over the course of
the school year. So you can't say child is performing similar to the middle
of the year, unless you took a comparison sample from the middle of the year.
- Finally,
there's a big problem with "of out of age performance" interpretation�
Example:
a first grader passes "3rd grade" items.
- This
"score" does NOT mean the child is doing 3rd grade work-
means the child is at about 2 or 3 sds for first graders.
- Tendency
to overgeneralize to other abilities than the tested abilities. ("Janey
is outstanding in Math, therefore we don't have to think about her English"--
wrong!)
- Generally,
avoid using grade norms. Yuck phooey bad norms!
Other
considerations
Remember!
The particular question you are trying to answer (decision you are trying to
make) determines what is the appropriate comparison group. If you are deciding
who to take into the US Army, then the potential pool is everyone in the USA.
So any selection test standardization sample needs to reflect that. If you are
deciding whom to hire in your Bowling Green bakery, you'll be choosing from
amongst local Kentuckians and your selection process norm group should reflect
that.
Culture
Issues
Case ex:
I was asked to evaluate for purposes of educational placement an immigrant child
who was not doing well in a school in the USA. She didn't speak English. The
families intention was to stay in the USA. What norms should be used to evaluate
ability? What questions might you need to consider?
What if
we changed the situation so that she was returning to her home country in a
month for the rest of her life and would need to know where to be placed when
she returned home?
Feel free to bring up this
question in the discussion board. It is a hard question so only pick one of the
issues to discuss.
To summarize
- Percentiles
are commonly used for interpretation to lay population
- Standard
scores (z, T, IQ) are favored by professionals because they are less likely
to be misinterpreted.
- Occasionally
use age norms
- Avoid
Grade norms!
Created January
30, 2000: Last Modified: January 30, 2005. All contents© Sally Kuhlenschmidt.


