
Normal
http://online.wsj.com/articles/trade-gap-narrows-to-41-54-billion-1407328522
By
Eric Morath
Updated Aug. 6, 2014 2:47 p.m. ET
WASHINGTON—The U.S. trade deficit narrowed more than expected in June amid a sharp decline in imports, a development that is likely to boost economic-growth readings but raises a concern about domestic demand.
The U.S. trade deficit shrank 7% to a seasonally adjusted $41.54 billion in June from May, the Commerce Department said Wednesday. That was the fastest contraction in the gap since November. Imports fell 1.2% in June, the steepest decline in a year, while exports increased 0.1% to reach a record high.
The smaller gap than projected has many economists expecting the government to upgrade its measure of second-quarter gross domestic product later this month. The trade deficit has shrunk about 6% since March; a narrower trade deficit generally supports economic growth.
Forecasting firm Macroeconomic Advisers now projects GDP, the broadest measure of goods and services produced across the economy, expanded at 4.2% rate in the quarter. Other economists project as high as a 4.5% gain. Last week, the Commerce Department said second-quarter GDP expanded at 4.0% annual pace.
The latest data also may support third-quarter growth. Imports, especially outside of oil, surged in April and May but fell back in June. "A further correction is likely over the next two months," said IHS Global Insight economist Patrick Newport. "As a result, imports will be a much smaller drag on growth than they were in the second quarter."
But the trend isn't entirely positive. It suggests importers may not be confident that U.S. consumers will ramp up spending in the second half. That runs counter to the Commerce Department's measure of consumer spending, which increased steadily during the second quarter.
The June decline in imports was led by decreased U.S. demand for consumer goods, cars and car parts, and foreign oil.
"The broad-based declines in import activity seem at odds with the narrative of improving domestic demand," said TD Securities economist Millan Mulraine.
Growth in consumer spending eased in the first quarter and exports fell, contributing to the economy contracting at a 2.1% rate. Those factors reversed in the second quarter, supporting the rebound in growth.

Exports rose sharply in May and held those gains in June. The small June improvement was led by increased foreign demand for U.S. cars, consumer goods and services, which include travel and intellectual-property use.
The numbers coincide with improved growth in China this spring and a stabilizing European economy. However, unrest in the Mideast, Africa and Ukraine could pose headwinds to global trade.
The U.S. trade ledger with Russia fell in June amid an escalating sanctions battle over the conflict in Ukraine. Exports plummeted 34% on the month to the lowest level since January last year. Imports from Russia fell nearly 10%. Russia, however, accounts for a relatively small share of total U.S. trade.
Trade with China, the No. 2 U.S. partner, has expanded modestly this year. The U.S. trade gap for goods with China widened 4.9% through June, compared with the same period a year earlier. That is only slightly larger than the 4% overall growth in the goods-trade deficit.
The goods deficit with European Union expanded 15.2% in the first half. The gap with Canada, the largest U.S. trading partner, widened this year. But the gap with Mexico, Japan and Brazil narrowed during the first six months of 2014.
—Ian Talley contributed to this article.
Write to Eric Morath at eric.morath@wsj.com and Jonathan House at jonathan.house@wsj.com
by Tyler Cowen on August 6, 2014 at 2:28 pm in Economics, Education, Web/Tech | Permalink
The Upshot surveys some optimistic and pessimistic views. I thought it would be useful to restate my views in a single, simple blog post, here is the enumeration:
1. The law of comparative advantage has not been repealed. Machines take away some jobs and create others, while producing more output overall.
2. That said, some particular kinds of machines increase the relative return to skilled labor. If the new jobs require working with computers, and working with computers effectively is hard, reemploying lower-skilled workers at good wages may be difficult.
3. Smart software, factor price equalization, and better measurement of value have all boosted income inequality. Returns to working for low-skilled workers have fallen or stagnated in many regions (not North Dakota). Returns for many higher skilled workers have risen, but most of them were working and working hard already.
4. Lower returns to unskilled labor mean (on average) that low-skilled laborers will work less. This effect may interact with government benefits but sometimes people decide to work less or search less hard for a job for reasons unrelated to benefits. These decisions may produce feedback which weakens pro-work norms in the broader culture.
5. The employment to population ratio will be lower than it otherwise would have been, because of “robots” but not only robots. The natural rate of unemployment will be higher too.
6. Many of the new service sectors jobs will be better suited to women rather than the most unruly men. Physical strength will matter less, conscientiousness and teamwork will matter more, and much of the burden of these adjustments will fall on lesser educated men.
7. Facebook makes it easier to get sex and keep friends without having a job.
8. There is good evidence for each of these propositions, although it may be questioned how great is their combined import. In the meantime, yes robots may lower employment, although the catchphrase “robots are destroying jobs” is misleading rather than illuminating.
 82 comments 45 1119 Reddit78
- See more at: http://marginalrevolution.com/#sthash.VGxo8oGK.dpuf
August 6, 2014
How differently would the U.S. economy have performed without the Federal Reserve's efforts to stimulate the economy through its most recent Quantitative Easing (QE) programs?
Those programs were first initiated back in September 2012, when the Fed announced that it would act for the third time to offset a weakening economy by buying up large quantities of Mortgage Backed Securities (MBS) at a rate of $40 billion per month, which we've previously described as QE 3.0. Three months later, the Federal Reserve announced that it would expand its efforts to boost the U.S. economy to avoid falling into recession by buying up large quantities of U.S. Treasury securities at the rate of $45 billion per month, which we've subsequently identified as QE 4.0 to distinguish that effort from the continuing QE 3.0.
We first tackled the question in September 2013, in which we found that the Fed's QE efforts boosted the performance of the U.S. economy by roughly one dollar for each dollar it used to buy MBS and U.S. Treasuries in its QE programs, which was more than enough to avoid what otherwise would have been a major Greek or Spanish-style contraction in the U.S. economy from the large tax hikes that took effect in the U.S. in 2013.
By the third quarter of 2013, the Federal Reserve was coming to the conclusion that it would not need to continue its QE programs, as the U.S. economy suddenly seemed to achieve some degree of organic growth that had previously been absent, above and beyond what the Fed was able to achieve. That strength continued into the fourth quarter and the Federal Reserve announced that it would begin reducing its QE-related purchases of MBS and U.S. Treasuries. The Fed has since tapered their purchases of these securities every six weeks by $5 billion per month for each type, which would see their buying activity end sometime in the fourth quarter of 2014.
We haven't discussed this data since December 2013, so now that the BEA has released itsannual revision of the United States' Gross Domestic Product (GDP) , we're going to put ourKeynesian-style GDP multiplier tool to the test once more and incorporate all the revised and updated GDP data we now have, which covers the period through the first estimate of GDP in the second quarter of 2014. The chart below reveals the results of our newest counterfactual exercise.

Before we continue, we should note a major change in our assumptions regarding the impact of the 2013 tax increases. Here, with the increase in payroll, income, investment and Affordable Care Act taxes implemented so early in 2013, we assume that in 2014, Americans have largely adapted to their higher tax burdens enough so that the negative shock from these increased taxes is no longer weighing against the growth of GDP. Their negative impact is now best described as a permanent loss to the U.S. economy.
What we observe now is that the organic growth that first appeared in the third quarter of 2013 had evaporated by the first quarter of 2014. That makes sense when you realize that this growth was really the effect of a record bumper crop for almost every agricultural crop grown in the U.S., which benefited from ideal growing conditions through much of 2013. Those record crops were harvested in the third quarter of 2013, accounting for much the apparent boost in economic growth in that quarter, and then into the fourth quarter of 2013, as much of the harvested crops were subsequently exported from the U.S. to other markets, such as China.
By the time the first quarter of 2014 rolled around, all that additional economic activity resulting from the bumper crops of 2013 was gone. Consequently, GDP fell back to the level that it would otherwise have been without the benefit of those bumper crops for the economy. The level that would be predicted after considering the fiscal drag from previous tax hikes, minor government spending cuts begin offset dollar for dollar by the Fed's QE programs.
We next observe that the first estimate of GDP in the second quarter of 2014 is above the level that would be expected in our counterfactual model. That could be due to the economy showing some small signs of hopefully more sustainable organic growth once again, or perhaps could be due to the BEA overestimating GDP growth in its first estimate of GDP for the quarter once again, as it originally did by a substantial margin for the first quarter of 2014. The BEA will revise its estimates of GDP for the second quarter of 2014 twice more during the next two months.
These observations suggest that the U.S. economy is still very dependent upon the Fed's QE programs to realize economic growth, even after assuming that 2013's tax hikes are no longer continuing to negatively impact the U.S. economy. Even with its tapering of those programs, we find that the U.S. economy would have contracted much more severely during the first quarter of 2014 and would have further contracted in the second quarter of 2014 in the absence of the Fed's QE-related activities.
As the Fed's tapering of its MBS and U.S. Treasury purchases continues, we can expect a lessening positive contribution from that activity. That means that economic growth in the U.S. throughout the rest of 2014 is likely to be muted at best given how it has performed outside of what now clearly appears to have been exceptional circumstances.
 We featured a discussion of the fiscal multipliers for government spending and tax policies in ourprevious discussion of Spain's disastrous economic choices of 2012. At present, we're continuing to assume that the fiscal multiplier for the Fed's quantitative easing programs is approximately 1.0, in the absence of data that might contradict that figure. As yet, there really isn't any data to contradict this estimate, although with the latest GDP revision, the data suggests the multiplier rounds down to that figure.
Board of Governors of the Federal Reserve System. All Federal Reserve Banks - Total Assets, Eliminations from Consolidation. [Text Document]. Accessed 4 August 2014.
Cloyne, James. What Are the Effects of Tax Changes in the United Kingdom? New Evidence from a Narrative Evaluation. [PDF Document]. CESIFO Working Paper No. 3433. April 2011.
Owyang, Michael T., Ramey, Valerie A. and Zubairy, Sarah. Are Government Spending Multipliers Greater During Periods of Slack? Evidence from 20th Century Historical Data. [PDF Document]. Federal Reserve Bank of St. Louis. Economic Research Division. Working Paper 2013-004A. January 2013.
Romer, Christina D. and Romer, David H. The Macroeconomic Effects of Tax Changes: Estimates Based on a New Measure of Fiscal Shocks. [PDF Document]. March 2007.
U.S. Bureau of Economic Analysis. National Income and Product Accounts, Gross Domestic Product: Second Quarter 2014 (Advance Estimate), Annual Revision: 1999 through First Quarter 2014. [Text Document]. 30 July 2014.
Daniel J. Mitchell | Jul 24, 2014


I’m currently in Asia, where I just finished a series of speeches about economic policy in China and Hong Kong.
These two jurisdictions offer very powerful lessons about the importance of economic policy.
Hong Kong is supposed to be Nirvana for libertarians. It holds the top spot in the Economic Freedom of the World rankings. It has an optional flat tax. It has a private retirement system. And based on IMF data, government spending “only” consumes 18.4 percent of GDP (compared to 38.6 percent of economic output in the United States and 54.4 percent of GDP in France).
In reality, Hong Kong is far from perfect. It may have a lot more economic freedom than other jurisdictions, but there is widespread government intervention in certain sectors, such as housing. And while a flat tax and spending burden of 18.4 percent of GDP sound good, let’s not forget that the western world became rich in the 1800s when there was no income tax and the public sector consumed less than 10 percent of GDP.
But when you rank countries on the basis of economic freedom, you don’t compare jurisdictions to a nonexistent libertarian utopia. You compare them to other nations. So Hong Kong gets the top spot. And that’s paying dividends. When you look at long-run comparisons with other nations, Hong Kong hasgrown faster and become more prosperous.
So what about China? This wasn’t my first visit to the country, but it was the first time I went to Shanghai, and it is a very impressive place. It’s obvious that China has enjoyed a lot of growth in the past few decades.
But just as you shouldn’t judge the United States by a visit to Wall Street, it would be a mistake to draw sweeping conclusions about China after a few days in Shanghai.
Indeed, average living standards for all of China are still far below American levels. Moreover, if you look at the Economic Freedom of the World rankings, China still has a lot of room for improvement. It ranks 123rd out of 152 nations, which is not only far below France (#40), but also Greece (#85), Haiti (#98), and Russia (#101).
That being said, China’s score is 6.22 out of 10, which is a vast improvement compared to where it was in 1980, when it had a score of only 4.00.
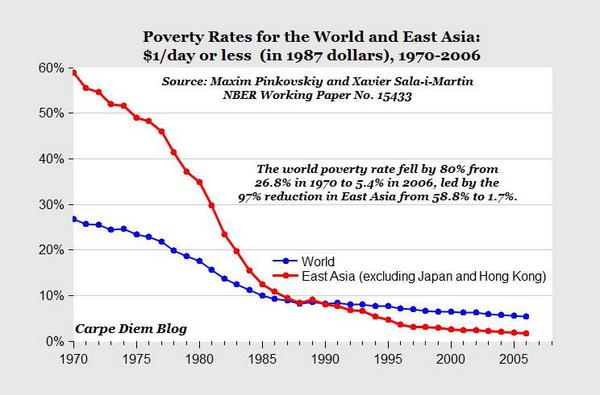
This has led to some wonderful outcomes. This chart (h/t: Mark Perry) shows the share of the world’s population living on less than $1 per day (blue line) and the share of East Asia’s population with the same level of deprivation (red line). A big reason the red line has fallen so dramatically is that severe poverty in China has largely disappeared.
The real question for China is the degree to which there will be ongoing improvement.
I think it would be good if China became more like Hong Kong and that this led to much higher living standards. Heck, I’d be happy if China became more likeTaiwan or South Korea, both of which have become relatively rich nations by moving substantially in the direction of free markets and small government.
But I don’t think this will happen. In one of my speeches, I posed a series of questions, followed by some less-than-optimistic answers.
Is the financial system weak? (because of too much state control over capital flows and investment)
Is there too much cronyism? (with friends and relatives getting favorable access to business)
Will China’s demographics be a problem? (the one-child policy is not just tyrannical, but it also means China’s population is aging)
Is rapid growth sustainable? (in the absence of reforms to boost economic freedom)
Have stimulus plans led to malinvestment? (such as ghost cities and other boondoggles)
Since economists are lousy when they make predictions, it’s quite possible that I’m wrong and my pessimism is unwarranted. For the sake of the Chinese people, let’s hope so.
And what about Hong Kong? I suspect they’ll remain the freest economy in the world. After all, why wreck a good thing?
Then again, the United States was the world’s 3rd-freest economy as recently as 2001. Now, thanks to Bush-Obama statism, we’ve plummeted to 17 in the ranking.
But I doubt Hong Kong policy makers would be equally foolish.
Daniel J. Mitchell is a top expert on tax reform and supply-side tax policy at the Cato Institute.
By
Tamar Jacoby
Updated July 22, 2014 5:34 p.m. ET
ANTHONY SOLIS, WELDER | Some welders can earn more than $100,000 a year. Eric Kayne for The Wall Street Journal
Dakota Blazier had made a big decision. Friendly and fresh-faced, from a small town north of Indianapolis, he'd made up his mind: He wasn't going to college.
"I discovered a long time ago," he explained, "I'm not book smart. I don't like sitting still, and I learn better when the problem is practical." But he didn't feel this limited his options—to the contrary. And he was executing a plan as purposeful as that of any of his high-school peers.
It started in his junior year with release time from high school to take a course in basic construction skills at a craft training center run by the Associated Builders and Contractors. The next step was an internship with a local contractor, Gaylor Electric.
This summer, he's at Gaylor full time, earning $10 an hour plus credits he can apply at the ABC training center, where he intends to return this fall for a four-year apprenticeship. Mr. Blazier, 18, beamed as he explained his plan. This was no fallback, no desperate Hail Mary pass. It was a thoughtful choice—and he was as proud and excited as if he were heading off to the Ivy League.
College-educated Americans tend to know mostly other college-educated Americans and to think that is the norm, if not universal. In fact, just three in 10 Americans age 25 or older have bachelor's degrees. Another 8% are high-school dropouts, leaving the overwhelming majority—more than 60%—in circumstances something like Mr. Blazier's.
The questions that keep him up at night aren't about inequality: How rich am I, or, how rich is my neighbor ? What he worries about is the kinds of opportunities open to him. Can he get an education that equips him for a job he wants? Can he find that job and build on it to make a career? His concern is economic mobility.
The changing economy isn't encouraging. New technologies and globalization are driving deep-seated change—and no one knows for sure what it will mean for most Americans. But one thing is certain: The future will put a premium on technical skill. Educators and employers agree: High school is no longer enough.
Americans have a host of postsecondary options other than a four-year degree—associate degrees, occupational certificates, industry certifications, apprenticeships. Many economists are bullish about the prospects of what they call "middle-skilled" workers. In coming years, according to some, at least a third and perhaps closer to half of all U.S. jobs will require more than high school but less than four years of college—and most will involve some sort of technical or practical training.
STEPHANIE RABELLO, REGISTERED NURSE | Working her way from practical nurse to registered nurse to bachelor-degree nurse. Preston Mack for The Wall Street Journal
Will these be just jobs—or real careers? Is the system preparing enough Americans to fill them? Are there adequate opportunities for training? Do we do enough to steer young people toward technical training?
As Mr. Blazier knows, there are plenty of opportunities for people like him to get ahead. Despite our digital-age prejudices against practical skills, Americans are quietly reinventing upward mobility. Consider three often overlooked paths: welder, nurse and franchise manager.
The first requirement of any upward path is entry ramps at the ground level. The Craft Training Center of the Coastal Bend, in Corpus Christi, Texas, teaches welding to 200 high-school students, mostly at-risk youth. When Anthony Solis first heard about the program, he was close to dropping out. He didn't know what welding was but decided to give it a try—at least it would get him out of class a few days a week.
Unlike his father, who didn't need even a high-school diploma to make a decent living on an oil rig, Mr. Solis, now 19, knew he needed some kind of qualification. He found that he liked the hands-on aspect of the training program. Suddenly, math came more easily—he needed it to calculate weight and volumes.
Welding itself was harder, but he learned that he could do well if he tried—something he'd rarely experienced in a classroom. Soon, he was attending not just his for-credit class but also an adult program in the evening, and he returned to the center that summer for a career-prep course—all of it subsidized by his high school and a local employer group.
The second requirement of any good upward path is for training to lead to a job. Mr. Solis's big break came last August, when he and 20 other Coastal Bend students auditioned for JV Industrial, which does high-risk, high-paying maintenance work in oil refineries. JV had never recruited at the Corpus Christi center, and Mr. Solis was so nervous that he was almost ill on the day of the hands-on test. Still, he made the grade and headed off to Houston for more free training—with the possibility of a big job if he finished.
A third requirement of a good career path is that it must be aligned with economic needs. This is where employers like JV can make all the difference. Many high schools and community colleges teach job skills, but too many of them use outmoded techniques and equipment or steer young people to industries that aren't growing. The best way to stay current is to partner with an employer, who can offer advice about what's in demand, help design curricula, lend equipment, even—like JV—provide training.
It isn't always easy to find an industry partner: Training is expensive, and some firms fear that competitors will poach the workers whom they train. But a growing number of farsighted companies—often bigger firms in growing fields such as construction, manufacturing or IT—grasp the mutual benefit. What better way, after all, to attract and retain good employees?
This is especially true in a trade like welding, where demand can sometimes seem insatiable. The average age in the field is 54, and the American Welding Society predicts openings for more than 400,000 workers by 2024—welders and others who need welding skills, such as pipe fitters, plumbers and boilermakers. The Bureau of Labor Statistics pegs the average wage at $36,300 a year, but anecdotal evidence suggests that is the low end of what's possible. JV Industrial says that it pays more like $75,000, with some employees earning more than $100,000. In the burgeoning shale industry, in Texas and Appalachia, welders can earn as much as $7,000 a week.
Like construction, nursing is a time-tested path to the middle class, and it has many of the same hallmarks: easy on-ramps, goal-oriented job training and a series of ascending steps, with industry-certified credentials to guide the way.
The profession is already growing robustly. From 2000 to 2010, the number of registered nurses increased by 24%. But the aging of the baby-boom generation will sharpen demand even as it reduces supply: Roughly a third of today's nurses are more than 50 years old.
Consider one microcosm: Orlando, Fla., where there are many different ways into the nursing profession. The University of Central Florida trains only bachelor-degree nurses. You need an outstanding high-school record, there's a long waiting list, and tuition is $14,000 for in-state students—and more than three times that if you're not from Florida. Two well-equipped, award-winning community colleges—Seminole State and Valencia State—offer associate-degree RN programs, where tuition is $7,500. Then there is Orlando Tech, a county-run career center, located in an old building in an industrial area near downtown, which trains licensed practical nurses for about $5,000.
It sounds insidious—a quintessentially inequitable, tracked system, with RNs earning some $65,000 year and many licensed practical nurses, or LPNs, starting below $40,000. But appearances can be deceptive. Alongside the three tiers, there are myriad ways that different kinds of students can tap into the programs and transfer among them, building their own upward paths, sometimes over the course of a lifetime.
The streamlined route starts in high school: a "dual enrollment" magnet program that allows focused, able students to earn college credit and professional certifications, including as a nursing assistant. Participants who enroll within two years at Seminole or Valencia get advanced placement credit, saving as much as $1,250. And those who are really in a hurry can matriculate simultaneously at UCF, earning "concurrent" credit for advanced courses taken at community-college prices, then graduate in just three years with a UCF bachelor's degree.
More often, though, the path up through the system is slow—an intermittent process with many phases. When Stephanie Rabello, 41, graduated from high school in the early 1990s, all she could think about was getting into the nursing profession—the sooner, the better—and she enrolled in a 10-month LPN program at a local career center.
Her LPN license opened several doors: She worked in an elementary school, a nursing home, a rehab hospital, often two jobs at once. But after nearly 20 years as a practical nurse, she decided that she wanted more respect and better compensation. So in 2012, she went back to school at Seminole State, enrolling in a yearlong LPN-to-RN "bridge" program with online classes and convenient clinical rotations that allowed her to continue working while she upgraded.
Sherry Harris, 33, who followed a similar path from LPN to RN, calls it "step-by-step" professional training—the "working-class way in." Ms. Harris is now taking the next step: an RN-to-BSN program for a bachelor of science degree in nursing.
Ms. Rabello also wants a bachelor's degree and is hoping to enroll next spring at UCF. But for now, she's happy where she is. "I used to be a floor nurse," she said. "When I graduated as an RN, the facility promoted me to unit manager. That's exactly where I want to be—getting some respect and moving up the ladder."
At first blush, franchising seems very different from welding and nursing—no technical skills, no required training, no earned industry certifications. But in many ways, it is a looser, market-driven version of the same upward path: Young people start at the bottom of a practical trade and learn by doing.
SHANA GONZALES, FRANCHISE RESTAURANT OWNER | She started as a cashier at Taco Bell and now owns four restaurants in Atlanta. Raymond McCrea Jones for The Wall Street Journal
Looking back, Shana Gonzales, 41, says that she always wanted to be an entrepreneur. She came from a family of modest means: Her father was a coal-miner in Arizona. Her first franchise job, in the early 1990s, was at a Taco Bell, where she worked as a part-time cashier while attending community college.
More than 20 years later, she owns and operates four fast-food restaurants in Atlanta that generate $3.5 million in annual revenue.
It wasn't an easy path, but it isn't uncommon in the franchise industry. At McDonald's, MCD -0.96% some 60% of what the company calls "owner/operators" started as hourly employees, as did 63% of the chain's two dozen U.S. regional managers.
Ms. Gonzales's first break came after nine months on the job. She was focused on her college classes and working just to earn some extra cash. But the store manager noticed her: She was responsible, took initiative and seemed curious about how the restaurant operated. Ms. Gonzales agreed to undergo training, then spent 12 weeks studying a textbook and shadowing an assistant manager. This qualified her as a shift manager.
She didn't expect the next promotion either, or the one after that, although by then she'd been working in fast-food outlets for nearly four years. Except for those first 12 weeks, everything she knew about the restaurant business was self-taught. But the third promotion was a big job: general manager, running her own store, with a regular salary and 15 direct reports.
It was then that Ms. Gonzales started to see that the franchise business might be more than just a job—there might be a career in it. By this time, she was working for the Rally's Hamburgers brand, which was purchased that year by a bigger company with a more corporate culture. Ms. Gonzales and other midlevel managers were brought to Tampa periodically for presentations and networking. She still remembers how eye-opening it was. "The others had all started behind the counter too," she recalls. "But this was the first time I had ever met other people like me—people with the same desire to work hard and give everything they had to the company." By 2003, when she left what was then Checkers Rally's, she was manager of operations for Arizona and California, earning more than $100,000 a year in salary and bonuses.
Ms. Gonzales's next boss, Aziz Hashim, has his own rags-to-riches story. He started out in what he calls a "lower middle-class" immigrant family in Los Angeles and earned a prestigious degree as an electrical engineer—then quit abruptly to go into the franchise business. Today, his company, NRD Holdings, owns more than 50 franchise outlets, and he is seen as a rising star in the industry.
Still, he explains, neither he nor Ms. Gonzales is an anomaly. "If you work hard in this business," he says, "you can't help but rise. We owners have no choice but to hire from within and train our own managers. No one comes out of school knowing how to run a fast-food restaurant."
The hardest step up the franchising ladder is from management to ownership. Franchising is the safest way to start a small business. Though lesser-known brands can pose risks, most outlets open with a popular product and a proven way of doing business. But it isn't cheap to get started: The initial purchase fee is rarely less than $100,000 and usually several times that.
Mr. Hashim's parents lent him their life savings. His company has a program called "Own It!" to help his top managers make the transition. Ms. Gonzales used his help to buy four Checkers outlets and just this summer finished paying off her loan. Her goal is to buy 10 more stores in the next five years.
Today's conventional wisdom about economic mobility in the U.S. is gloomy and growing gloomier. We're told that good jobs are disappearing, that less educated workers have bad work habits, that the U.S. is falling behind other countries.
What's strange is that this isn't what you hear from many people who are working toward the middle class: people training, saving and in other ways striving to make it, who invariably see more dynamism and possibility. Ms. Gonzales described her path as "opportunity after opportunity. Every time I think about getting out of the business," she says, "something exciting happens—a promotion or a new direction that keeps me engaged."
Who's right? Surely, the answer is up to us—and not just the strivers alone. One place to start would be by showing some respect for practical training. As millions of Americans know, even in a knowledge economy, countless valuable career skills can be learned outside a college classroom.
Ms. Jacoby is the president of Opportunity America, a Washington-based nonprofit group working to promote economic mobility. She is the author of "Someone Else's House: America's Unfinished Struggle for Integration" and the editor of "Reinventing the Melting Pot: The New Immigrants and What It Means to Be American."
Corrections & Amplifications
An earlier version of this article incorrectly attributed the prediction of openings for more than 400,000 welders by 2024 to the American Welding Institute.
By
Vernon L. Smith
July 23, 2014 8:01 p.m. ET
The rescue of incumbent investors in the government bailout of the largest U.S. banks in the autumn of 2008 has been widely viewed as unfair, as indeed it was in applying different rules to different players. The bailout through the Troubled Asset Relief Program has been justified by the Federal Reserve and Treasury as preventing a financial collapse of the economy.
The rescue, however, had a hidden cost for the economy that is difficult to quantify but can be crippling. New economic activity is hobbled if it is not freed from the burden of sharing its return with investors who bore risks that failed. The demand for new economic activity is enlarged when its return does not have to be shared with former claimants protected from the consequences of their risk-taking. This is the function of bankruptcy in an economic system organized on loss as well as profit principles of motivation.
Financial failure and the restructuring of assets and liabilities motivates new capital to flow directly into new enterprise activity at the cutting edge of technology—the source of new products, output and employment which in turn provide new growth and recovery. Requiring new investment to share its return with failed predecessors is tantamount to having required Henry Ford to share the return from investment in his new horseless carriage with the carriage makers, livery stables and horse-breeding farms that his innovation would render obsolete.
This burden on new investment helps explain the historically weak recovery since the "Great Recession" officially ended in June 2009, and the recent downturn in gross-domestic-product growth. The GDP growth rate for all of 2013 was just 1.9%, and in the first quarter of 2014 it declined at a seasonally adjusted annual rate of 2.9%.
Enlarge Image
Getty Images
With only two balance-sheet crises in the U.S. in the past 80 years, 1929-33 and 2007-09, we have little experience against which to test alternative policies and economic responses. Japan and Sweden are examples of economies that followed distinct pathways after crises in the early 1990s. In Japan the economy floundered in slow growth for over two decades; Sweden recovered much more quickly. The difference can be attributed to following different policies in the treatment of severe bank distress.
Japan's real-estate market suffered a major decline in the early 1990s. Home prices peaked in the fall of 1990 and fell by 25% in two years. By 2004 they had fallen 65%. Meanwhile, nonperforming loans continued to escalate throughout this 14-year period.
Japanese policy permitted banks to carry mortgage loans at book value regardless of their accumulating loss. Loans were expanded to existing borrowers to enable them to continue to meet their mortgage payments. This response could be rationalized as "smoothing out the bump." Bank investors were protected from failure by stretching out any ultimate return on their investment, relying on a presumed recovery from new growth that never materialized. This accounting cover-up was coupled with government deficit spending—tax revenues declined and expenditures rose—as a means of stimulating economic growth that was delayed into the future.
From the beginning Japan was caught in the black hole of too much negative equity. The banks, burdened with large inventories of bad loans, geared down into debt reduction mode, reluctant to incur more debt, much as their household mortgage customers were mired in underwater mortgages and reluctant to spend. The result was a decade of lost growth that stretched into and absorbed a second decade of dismal performance. The policy cure—save the banks and their incumbent investors—created the sink that exceeded the pull of recovery forces.
Sweden's response to deep recession in the early 1990s was the opposite of Japan's: Bank shareholders were required to absorb loan losses, although the government financed enough of the bank losses on bad assets to protect bank bondholders from default. This was a mistake: Bondholders assumed the risk of default, and a bank's failure should have required bondholder "haircuts" if needed. Nevertheless, the result was recovery from a severe downturn. By 1994 Sweden's loan losses had bottomed out and lending began a slow recovery that accelerated after 1999.
The political process will always favor prominent incumbent investors. They are visible; they contribute to election campaigns; they assist in the choice of secretaries of Treasury and advisers and they suffer badly from balance-sheet crises like the Great Recession and the Great Depression. Invisible are the investors whose capital will flow into the new economic activity that constitutes the recovery.
Growth in both employment and output depends vitally on new and young companies. Unfortunately, U.S. firms face exceptionally high corporate income-tax rates, the highest in the developed world at 35%, which hobbles growth and investment. Now the Obama administration is going after firms that reincorporate overseas for tax purposes. Last week Treasury Secretary Jack Lew wrote a letter to the chairman of the House Ways and Means Committee urging Congress to "enact legislation immediately . . . to shut down this abuse of our tax system."
This is precisely the opposite of what U.S. policy makers should be doing. To encourage investment, the U.S. needs to lower its corporate rates by at least 10 percentage points and reduce the incentive to escape the out-of-line and unreasonably high corporate tax rate. Ideally, since young firms generally reinvest their profits in production and jobs, such taxes should fall only on business income after it is paid out to individuals. As long as business income is being reinvested it is growing new income for all.
There are no quick fixes. What we can do is reduce bureaucratic and tax barriers to the emergence and growth of new economic enterprises, which hold the keys to a real economic recovery.
Mr. Smith, a recipient of the 2002 Nobel Prize in economics, is a professor at Chapman University and the author, along with Steven D. Gjerstad, of the new book "Rethinking Housing Bubbles" (Cambridge University Press).
http://www.cato.org/publications/commentary/reflections-misery-index
This article appeared in the August 2014 issue of Globe Asia.
Recently, I calculated misery index scores for 89 countries (see: Globe Asia May 2014). For any country, a misery index score is simply the sum of the unemployment, inflation and bank lending rates, minus the percentage change in real GDP per capita. A higher misery index score reflects higher levels of “misery”.
The calculations I presented earlier represent a snapshot of the state of misery by country for 2013. In what follows, I present scores calculated over time for several regions and a few selected countries in Asia. These allow us to reflect on the scores in terms of their topological patterns.

The first chart shows the misery index patterns by major regions over the past decade. Several things are worth noting. Even on an aggregate basis, the chart features two poles of attraction: one centered at a score of twenty and another at ten. Countries that gravitate towards the higher pole generally need a heavy dose of structural (read: free-market) reforms. Conversely, countries closer to the lower pole have considerably more economic freedom.
Since the financial crisis of 2008-09, Southeast Asia’s level of misery declined from a score of roughly 20 to 11.7, which suggests that there has been positive structural reform in the region. I should also add that quantitative easing by the U.S. Federal Reserve generated significant hot-money flows that positively affected South East Asia.Western Europe’s endemic structural problems also show up in the chart. Since the crisis, the region’s misery score remained elevated because of pronounced problems in labor markets. To bring the score from its current 15.4 reading down to 10, Europe needs some significant economic liberalization.
Let’s now move from regional groupings to individual countries. Indonesia displays an interesting picture. Thanks to the disastrous advice of the International Monetary Fund (IMF), Indonesia floated the rupiah on 14 August 1997. Contrary to the IMF’s expectations, the rupiah did not float on a sea of tranquility. Its value plunged from 2,700 rupiahs per U.S. dollar, at the time of the float, to lows of nearly 16,000 rupiahs per U.S. dollar in 1998. In consequence, Indonesia’s inflation and its misery index score soared, and Suharto was brought down after 31 years in power. Then, the score fell sharply, and since the Wahid government, it has been drifting downward. Changes in Indonesia’s misery index score and its components are displayed in the accompanying table.

At present, Indonesia’s score of 20.0 is right on the magnetic twenty pole. Whoever is eventually crowned winner of the recent presidential election must introduce serious structural reforms if he wishes to see Indonesia’s misery index score fall towards the lower magnetic pole.

Narendra Modi, the newly elected prime minister of India, faces a misery index score of 24.5. Given the nature of India’s political system and bureaucracy, he certainly has his work cut out for him. Modi will have to go beyond voicing his plans for reforms to ensure their implementation and a significant reduction in India’s misery index score.

While still in Asia, we must take a look at two stellar performers, Chinaand Singapore: both have scoresbelow ten. China is note worthy because its misery index score was well below five during the 1997 –2005 period. It was then that the yuan was tightly linked to the U.S.dollar. China’s misery index score began to steadily climb only afterthe country allowed the yuan to appreciate against the green back due to pressure from Washington, D.C.

By most measures of competitiveness, Singapore holds one of the top spots. It’s not surprising, therefore, that Singapore’s misery index scores are low and even dipped into negative territory in 2010.

A topological trip down the misery index lane reveals two centers of gravity: twenty and ten.The countries whose scores hover around ten are simply reaping free-market dividends. Those with scores around twenty are rather miserable and serious candidates for deep free-market reforms. Without these reforms, those countries are destined to stay, well, miserable.

Steve H. Hanke is Professor of Applied Economics at the Johns Hopkins University in Baltimore, MD. He is also a Senior Fellow and Director of the Troubled Currencies Project at the Cato Institute in Washington, D.C. You can follow him on Twitter: @Steve_Hanke. Sign up to receive Prof. Hanke’s articles and distributions.
http://blogs.wsj.com/economics/2014/07/21/recent-college-graduates-have-seen-especially-sluggish-wage-growth/?mod=WSJBlog&mod=marketbeat
1:00 pm ET
Jul 21, 2014
Recent college graduates are paying a price for entering the workforce in the shadow of a deep recession: Their wages are growing far more slowly than the U.S. average.
“The wage growth gap points to continued weakness in the overall labor market,” wrote San Francisco Fed economists Bart Hobijn and Leila Bengali in an Economic Letter released Monday by the regional reserve bank.
College graduates typically earn more and enjoy more job security than workers without a degree. The unemployment rate in June for workers over the age of 25 with a bachelor’s degree or higher was 3.3%, compared with 5% for all workers 25 years and older and 6.1% for all workers 16 and older, according to the Labor Department.
But economists know that having the bad luck to graduate during a recession can have long-lasting consequences, including lower earnings for years to come.
That’s what happened with the recession that began in December 2007 and ended in June 2009. Mr. Hobijn and Ms. Bengali analyzed median weekly earnings for recent college graduates, defined as workers with a college degree between the ages of 21 and 25. They looked at wage growth in the years since 2007, rejiggering the calendar year to match the academic year at most colleges (so 2014 is May 2013 to April 2014).
From 2007 to 2014, the median weekly earnings of full-time U.S. workers rose 15%. Over the same period, the earnings of recent college graduates with full-time jobs rose just 5.9%. Both figures are unadjusted for inflation.
“With few exceptions, wage growth has been limited in all occupational groups for recent graduates,” the economists wrote, presenting “a clear pattern of low earnings growth for most categories.” The wage gap has been larger and more persistent than in past recessions, which they attributed to underlying weakness in the economy.
It’s not as though the rest of the workforce has been seeing especially robust wage growth, either. Average hourly earnings for all U.S. private-sector workers rose 2% in June from a year earlier, in line with the trend of recent years and roughly on par with rising prices in recent months.
Fed Chairwoman Janet Yellen last week cited slow wage growth, along with low labor-force participation, as evidence of “significant slack” in the labor market.
July 20, 2014
Who are the major holders of debt issued by the U.S. federal government going into the summer of 2014?
The answer is presented graphically below:
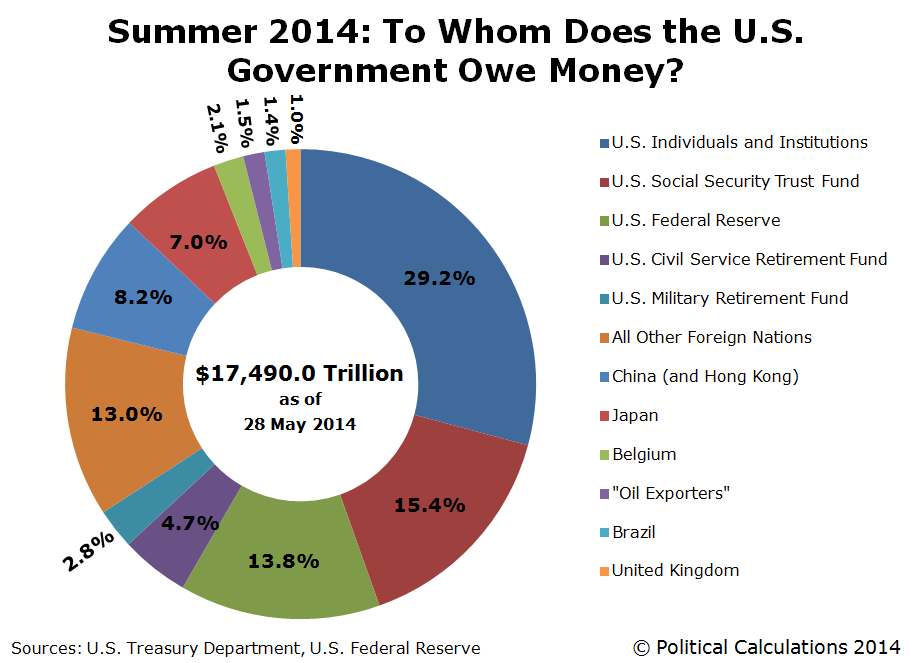
On the whole, there haven't been many changes since our previous edition. We see that the debt reported to be held by Belgium is still considerably inflated over historic levels, as this nation's banks would appear to have acted on behalf of Russian interests seeking to place their U.S. government-issued debt holdings in non-Russian financial institutions ahead of and in the months following Russia's actions to seize control of Crimea from Ukraine.
Our special area of focus on this update of our irregular series on the ownership of the U.S. national debt looks at the role of the Federal Reserve's Quantitative Easing (QE) programs as the central bank of the U.S. has gone from holding a low of $478.7 billion in U.S. government-issued debt securities on 18 June 2008 up to an astounding $2,414.8 billion on 28 May 2014. As of that date, the Federal Reserve held a a combination of $2,370.7 billion in U.S. Treasury securities and $44.1 billion in debt securities issued by other federal government agencies.
The Federal Reserves holdings of these securities now accounts for 13.8% of all the total public debt outstanding for the U.S. federal government, which totals $17.490 trillion as of 31 May 2014. On 1 January 2014, the U.S. national debt stood at $17.352 trillion, of which the Federal Reserve held some $2.266 trillion, or 13.06%.
The Federal Reserve also holds some $1,648 billion in mortgage-backed securities, which are primarily issued by government-backed entities, including the Government National Mortgage Association (Ginnie Mae), which is owned by the U.S. federal government, and the Federal National Mortgage Association (Fannie Mae) and the Federal Home Loan Mortgage Corporation (Freddie Mac), which are nominally private institutions, but which have been operating under government conservatorship since 2008. Although these government-backed entities issue mortgage-backed securities, their role is to collect and bundle the mortgages of U.S. homeowners and firms for the money they've borrowed into pools, which are then securitized and traded on the open market - it is not money borrowed by the U.S. Treasury or federal government agencies.

The Federal Reserve began its most recent round of QE government-issued debt buying in the fourth quarter of 2012, which it began doing to keep the U.S. economy from falling into a full-fledged recession at the time. Beginning in January 2014, the Federal Reserve has been steadily reducing the amounts its QE purchases every six weeks, as it believes the risk of falling into recession has diminished.
Even though the Federal Reserve has been reducing its purchases of U.S. government-issued debt securities since the beginning of 2014, as of 28 May 2014, it has boosted its net holdings of the federal government's liabilities by $148.8 billion. Meanwhile, the U.S. federal government borrowed an additional $138.1 billion from 1 January 2014 through 28 May 2014.
Or rather, the Federal Reserve has acquired 107.7% of the net new debt that has been issued by the U.S. Treasury and other federal government agencies during the first five months of 2014.
That's possible because of two factors. First, with the bills for U.S. federal income taxes coming due on 15 April 2014, the federal government experiences a surge of tax revenue during this part of the year, which can be enough to allow it to run a short-term surplus, reducing its need to borrow money during this period of time.
Second, the Federal Reserve is displacing other entities that lend money to the U.S. government, who are seeing their share of debt issued by the U.S. government fall as the debt they hold matures. That allows the U.S. Treasury to roll over a portion of the existing national debt and borrow more money, in this case, from the Fed, which doesn't show up as a net increase in the overall size of the national debt.
And that is how the U.S. Federal Reserve can lend more money to the U.S. federal government than the U.S. government appears to have borrowed, even as the Fed is reducing the amount it lends to the government!
Federal Reserve Statistical Release. H.4.1. Factors Affecting Reserve Balances. Release Date: 5 July 2013. [Online Document]. Accessed 16 July 2014.
U.S. Treasury. Major Foreign Holders of Treasury Securities. Accessed 16 July 2014.
U.S. Treasury. Monthly Treasury Statement of Receipts and Outlays of the United States Government for Fiscal Year 2013 Through May 31, 2014
http://online.wsj.com/articles/alan-reynolds-why-pikettys-wealth-data-are-worthless-1404945590
By
Alan Reynolds
July 9, 2014 6:39 p.m. ET
No book on economics in recent times has received such a glowing initial reception as Thomas Piketty's "Capital in the Twenty-First Century." He remains a hero on the left, but the honeymoon may be drawing to a sour close as evidence mounts that his numbers don't add up.
Mr. Piketty's headline claim is that capitalism must result in wealth becoming increasingly concentrated in fewer hands to a "potentially terrifying" degree, on the grounds that the rate of return to capital exceeds the rate of economic growth. Is there any empirical evidence to back up this sweeping assertion? The data in his book—purporting to show a growing inequality of wealth in France, the U.K., Sweden and particularly the United States—have been challenged. And that's where the story gets interesting.
In late May, Financial Times economics editor Chris Giles published anessay that found numerous errors in Mr. Piketty's data. Mr. Piketty's online "Response to FT" was mostly about Europe, where the errors Mr. Giles caught seem minor. But what about the U.S.?
Mr. Piketty makes a startling statement: The data in his book should now be disregarded in favor of a March 2014 Power Point presentation, available online, by Mr. Piketty's protégé, Gabriel Zucman (at the London School of Economics) and his frequent co-author Emmanuel Saez (of the University of California, Berkeley). The Zucman-Saez estimates, Mr. Piketty says, are "much more systematic" and "more reliable" than the estimates in his book and therefore "should be used as reference series for wealth inequality in the United States. . . (rather than the series reported in my book)."
Zucman-Saez concludes that there was a "large increase in the top 0.1% wealth share" since the 1986 Tax Reform, but "no increase below the top 0.1%." In other words, all of the increase in the wealth share of the top 1% is attributed to the top one-tenth of 1%—those with estimated wealth above $20 million. This is quite different from the graph in Mr. Piketty's book, which showed the wealth share of the top 1% (which begins at about $8 million, according to the Federal Reserve's Survey of Consumer Finances) in the U.S. falling from 31.4% in 1960 to 28.2% in 1970, then rising to about 33% since 1990.
Enlarge Image

David Gothard
In any event, the Zucman-Saez data are so misleading as to be worthless. They attempt to estimate top U.S. wealth shares on the basis of that portion of capital income reported on individual income tax returns—interest, dividends, rent and capital gains.
This won't work because federal tax laws in 1981, 1986, 1997 and 2003 momentously changed (1) the rules about which sorts of capital income have to be reported, (2) the tax incentives to report business income on individual rather than corporate tax forms, and (3) the tax incentives for high-income taxpayers to respond to lower tax rates on capital gains and dividends by realizing more capital gains and holding more dividend-paying stocks. Let's consider each of these issues:
• Tax reporting. Tax laws were changed from 1981 to 1997 to require that more capital income of high-income taxpayers be reported on individual returns, while excluding most capital income of middle-income savers and homeowners. This skews any purported increase in the inequality of wealth.
For example, interest income from tax-exempt municipal bonds was unreported before 1987—so the subsequent reporting of income created an illusory increase in top incomes and wealth. Since 1997, by contrast, most capital gains on home sales have disappeared from the tax returns of middle-income couples, thanks to a $500,000 tax exemption. And since the mid-1980s, most capital income and capital gains of middle-income savers began to vanish from tax returns by migrating into IRAs, 401(k)s and other retirement and college savings plans.
Balances in private retirement plans rose to $12.4 trillion in 2012 from $875 billion in 1984. Much of that hidden savings will gradually begin to show up on tax returns as baby boomers draw them down to live on, but they will then be reported as ordinary income, not capital income.
Tax law changes, in summary, have increased capital income reported at the top and shifted business income from corporate to individual tax returns, while sheltering most capital income of middle-income savers and homeowners. Using reported capital income to estimate changing wealth patterns is hopeless.
• Switching from corporate to individual tax returns. When individual tax rates dropped from 70% in 1980 to 28% in 1988, this provoked a massive shift: from retaining private business income inside C-corporations to letting earnings pass through to the owners' individual tax returns via partnerships, LLCs and Subchapter S corporations. From 1980 to 2007, reports the Congressional Budget Office, "the share of receipts generated by pass-through entities more than doubled over the period—from 14 percent to 38 percent." Moving capital income from one tax form to another did not mean the wealth of the top 1% increased. It simply moved.
• Tax rates and capital gains. There were huge, sustained increases in reported capital gains among the top 1% after the capital-gains tax was reduced to 20% from 28% in 1997, and when it was further reduced to 15% in 2003. Although more frequent asset sales showed up as an increase in capital income, realized gains are no more valuable than unrealized gains so realization of gains tells us almost nothing about wealth. Similarly, a portfolio shift from municipal bonds, coins or cash into dividend-paying stocks after the tax on dividends fell to 15% in 2003 might look like more capital income when it was merely swapping an untaxed asset for a taxable one.
In his book, Mr. Piketty constructed estimates of top wealth shares, decade by decade, melding and massaging different kinds of data (estate tax records, the Federal Reserve's Survey of Consumer Finances). These estimates are suspect in their own right; but as we now learn from Mr. Piketty's response to Mr. Giles, we can ignore them.
Yet Mr. Piketty's preferred alternative, the Zucman-Saez slide show, is also irreparably flawed as a guide to wealth concentration. Mr. Piketty's premonition of soaring U.S. wealth shares for the top 1% finds no credible support in his book or elsewhere.
Mr. Reynolds, a senior fellow with the Cato Institute, is author of a 2012 Cato Institute paper, "The Misuse of Top 1 Percent Income Shares as a Measure of Inequality."
http://www.nationalreview.com/article/381167/ex-im-bank-crony-capitalism-action-editors
June 25, 2014 4:00 AM
The Ex-Im Bank: Crony Capitalism in Action
By The Editors
Few Americans would be surprised to learn that a government agency that hands out generous loans and credit guarantees to a select number of corporations is corrupt and poorly managed. This impression has been repeatedly affirmed by the Export-Import Bank’s inspector general. The bank has a long history of dealing with dodgy firms and doling out suspiciously large amounts of loans to certain companies.
But now we don’t have to rely on reading between the lines of IG reports. It was revealed on Monday that four employees of the bank are being investigated by the Justice Department for allegedly accepting payments and gifts from Ex-Im beneficiaries. One of them has already been placed on leave from the bank (generally fed speak for “fired”).
Advertisement
Congressmen, who probably don’t read any more IG reports than the rest of us do, should remember this as they consider whether to reauthorize the bank, the funding for which expires at the end of September.
It’s heartening that Kevin McCarthy, the new House majority leader, already announced this past weekend that he opposes reauthorizing the bank. The previous majority leader, Eric Cantor, helped cut the deal that saved Ex-Im in 2012 but was defeated in a recent primary.
Cantor’s primary opponent emphasized during his campaign that he’d like to end crony capitalism. Plenty of other candidates in this year’s midterms — Republicans and Democrats — will talk a big game about the issue. There is no excuse, not even political necessity, for any of them to defend Ex-Im in this summer’s debate.
Those who vote for the bank’s continued survival are supporting a corrupt, near-rogue organization that wagers billions of taxpayer dollars per year. What does it all buy us? Ex-Im supports 2 percent of U.S. exports, most of them by large corporations such as Boeing and Caterpillar. (Boeing’s stock dropped 2 percent the day after Cantor lost.) Bank defenders argue that the U.S. needs an export-financing agency because other countries have them, but fear of unilateral disarmament has been largely discarded in other trade-policy debates.
If you’re wondering why it took so long to expose corruption at Ex-Im, it’s in part because the bank’s reporting on its own operations has been so irresponsible. This works to the advantage of its defenders in a number of ways. According to the bank’s IG, Ex-Im exaggerates the numbers of jobs its loans create by ignoring the distinction between full-time and part-time work; it doesn’t bother calculating default rates for specific sectors of its portfolio or stress-testing its entire book of business; and more. Some supporters of the bank want a bill that will reauthorize it while requiring reforms. But the inspector general has repeatedly criticized the bank for not carrying out the reforms required in the last reauthorization.
The kind of malfeasance that Ex-Im commits is, in some sense, inevitable. Public-choice economics teaches us that government programs work for special interests and bureaucrats, not the taxpayer. The corruption this engenders is certainly hard to investigate and fix, as we’ve seen at the VA and the IRS.
The good news is, basic economics teaches us that we don’t need to fix Ex-Im. We can just end it altogether.
By
Edward C. Prescott And
Lee E. Ohanian
Updated June 25, 2014 7:07 p.m. ET
In the first quarter of 2014, GDP in the U.S. plunged at a 2.9% annual rate, and productivity—the inflation-adjusted business output per hour worked—declined at a 3.5% annual rate. This is the worst productivity statistic since 1990. And productivity since 2005 has declined by more than 8% relative to its long-run trend. This means that business output is nearly $1 trillion less today than what it would be had productivity continued to grow at its average rate of about 2.5% per year.
Lagging productivity growth is an enormous problem because virtually all of the increase in Americans' standard of living is made possible by rising worker productivity. In our view, an important factor contributing to declining productivity growth is the large decline in the creation of new businesses. The creation rate of new businesses, as well as new plants built by existing firms, was about 30% lower in 2011 (the most recent year of data) compared with the annual average rate for the 1980s. (The data is the Census Bureau's Business Dynamic Statistics.) The decline affected nearly all business sectors.
Enlarge Image
Getty Images/iStockphoto
Virtually every state has suffered a drop in startups, which suggests that this is a national, and not a regional or state, problem. It may not be surprising that states hit hard by the recession, such as Arizona, California and Nevada, have a 25% to 35% lower rate of startups. But the startup rate in such business-friendly states as Tennessee, Texas and Utah is also down substantially, and in some cases exceeds the declines in the states that suffered most during the recession. Even North Dakota, which has benefited enormously from oil and gas fracking, has a startup rate lower than in the 1980s.
These numbers are likely to underestimate the decline in new business formation, because they do not count changes in the pace of new ideas and new business activity in existing establishments. The fact that the economy has been weak since 2007 suggests that new business activity has also declined in existing companies.
New businesses are critical for the U.S. economy to grow because a small fraction of today's startups will become tomorrow's economic heavyweights. Most of today's workers are employed at older, established businesses, but the country cannot rely on existing companies to boost the economy. Businesses have a life cycle, in which even the largest and most successful reach a stage at which they stop expanding.
If history is any indication, many of today's economic heavyweights will ultimately decline as new businesses take their place. Research by the Kaufman Foundation shows that only about half of the 1995 Fortune FT.T +2.94% 500 firms remained on the list in 2010.
Startups also have declined in high technology. John Haltiwanger of the University of Maryland reports that there are fewer startups in high technology and information-processing since 2000, as well as fewer high-growth startups—annual employment growth of more than 25%—across all sectors. Even more troubling is that the smaller number of high-growth startups is not growing as quickly as in the past.
Surveys of small-business owners clearly indicate that changes in economic policy are required to reverse this trend. Chamber of Commerce surveys show that roughly 80% of small-business owners believe that the U.S. economy is on the wrong track and that Washington is a major problem. Surveys by John Dearie and Courtney Gerduldig, authors of "Where the Jobs Are: Entrepreneurship and the Soul of the American Economy" (2013), show that entrepreneurs report being hamstrung by difficulties in finding skilled workers, by a complex tax code that penalizes small business, by regulations that raise the costs of doing business, and by difficulties in obtaining financing that have worsened since 2008.
There are clear solutions to these problems. Immigration reform that increases the pool of skilled workers and potential new entrepreneurs. Tax reform that reduces and equalizes marginal tax rates on capital income, including reducing the corporate income tax, which currently exceeds 40% in some states. Reforming Dodd-Frank to make it easier and cheaper for small business to obtain loans. Reducing the regulatory burden on all businesses.
In the absence of these reforms, there is little reason to believe that the depressed rate of new business creation will reverse itself. And if the trend is not reversed, then the current shortfall of $1 trillion per year in lost output due to lost productivity will continue.
Mr. Prescott, the 2004 Nobel Laureate in Economics, is professor of economics and director at the Center for the Advanced Study in Economic Efficiency at Arizona State University. Mr. Ohanian is professor of economics at UCLA, associate director at the Center for the Advanced Study in Economic Efficiency, and a senior fellow at the Hoover Institution.
August 9, 2014
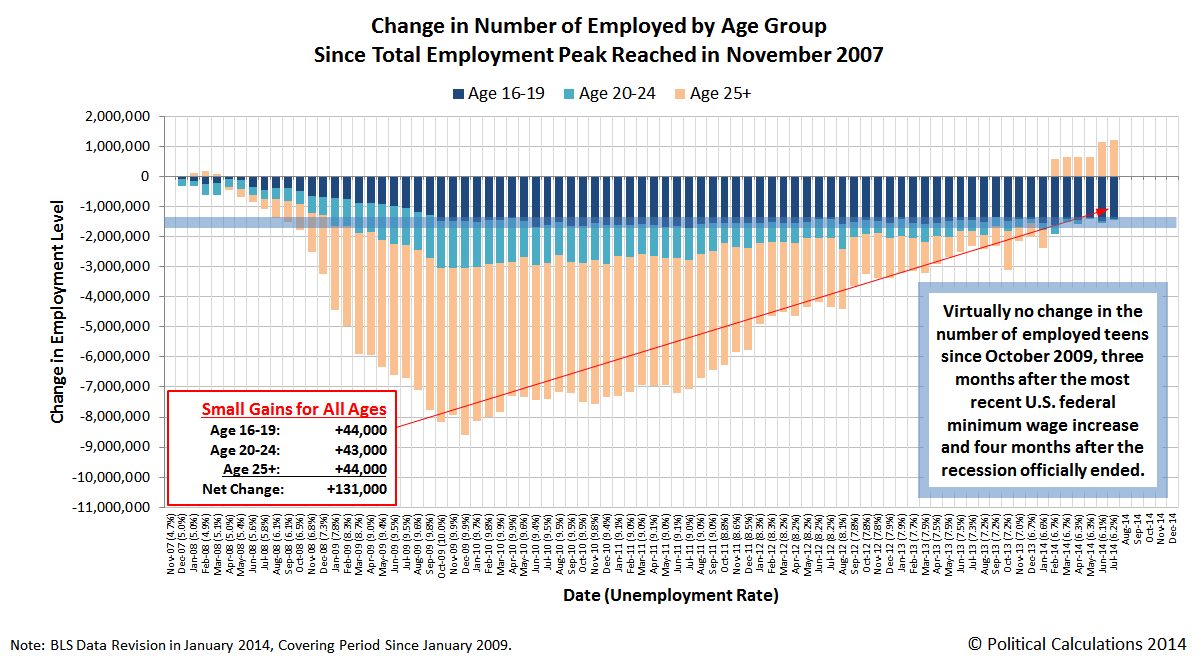
We've long been tracking how American teens, who make up the most marginal of workers in the U.S. economy, have fared with respect to older Americans in the U.S. job market since the total employment level last peaked in November 2007. As you can see in the chart below, things have not gone well at all for the least educated, least experienced and least skilled portion of the noninstitutionalized U.S. civilian labor force.
That's all the more remarkable when you consider how the relative number of marginal jobs has changed throughout this period, as measured by the difference between the total employment level in the U.S. and the number of nonfarm payroll jobs. Our next chart shows how these values have changed from January 2006 through July 2014.

Our next chart shows the difference between these two employment measures over that period of time, which shows the increase in the number of marginal jobs as a result of the recession, which have slowly dwindled as the economy has slowly recovered.
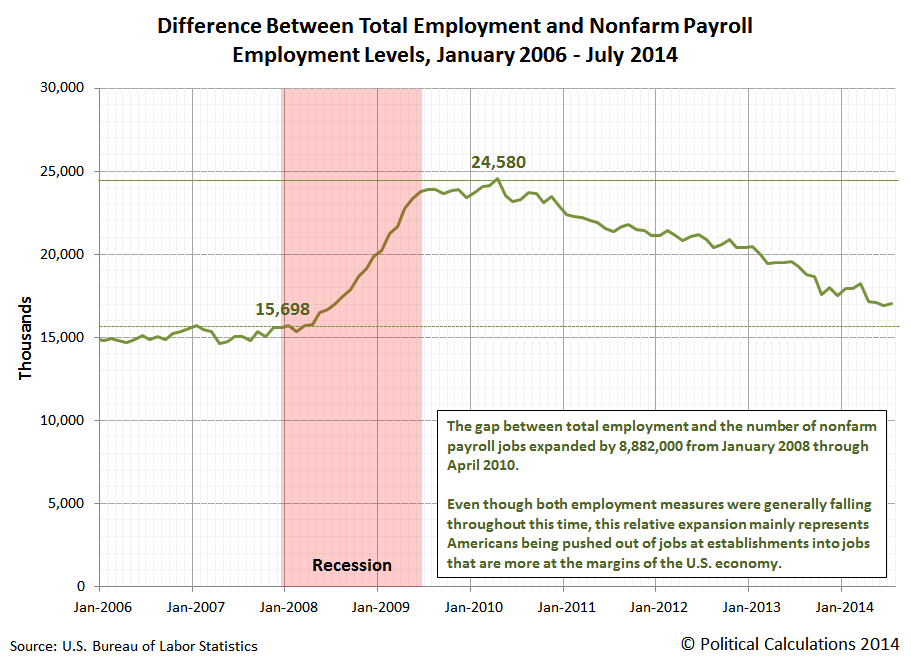
For this span of time, what we're primarily seeing is the change in the number of agricultural workers, self-employed workers whose businesses are unincorporated, unpaid family workers, and private household workers - the employment categories that are represented in the total employment figure but which are excluded from the nonfarm payroll employment figure. These are the kinds of jobs that are, almost by definition, considered to be at the margin of the U.S. economy.
To a much lesser extent, we're also seeing the reduction of employment for people who were working in multiple occupations prior to the recession, since these individuals are counted for each job they hold in the nonfarm payroll measure but are only counted as being employed once in the total employment level.
We say that is to a much lesser extent because the declines in the total employment level and nonfarm payroll employment level during this period of time is roughly equal to one another. But then, we see that the number of marginal jobs in the economy increased by approximately the same amount as these two job measured declined.
That's how we know that Americans who worked at establishments, or rather, established employers, were pushed into more marginal jobs after losing their payroll jobs during the recession. Or perhaps more accurately, after losing their unemployment insurance benefits, which we can observe in the lag between when the biggest job losses occurred during the recession as well as the timing and duration for when marginal employment peaked in the U.S. economy.
This Web Page Created with PageBreeze Free HTML Editor